
Website performance benchmarking is simply the process of measuring your site's speed and responsiveness against two key things: your own past performance and your direct competitors. It gives you a clear, data-driven picture of where you stand, turning vague goals like "be faster" into concrete, actionable targets. This whole process is vital for improving how users experience your site and, ultimately, hitting your business goals.
Why Website Performance Benchmarking Matters
Think of benchmarking as a regular health check-up for your website. A runner tracks their mile time and heart rate against personal bests and other athletes, right? In the same way, benchmarking lets you measure your website's speed against its own history and what others in your industry are doing. It's not just about chasing faster load times for the sake of it; it's about understanding exactly where you are in the digital race.
This process shines a light on how your site's performance directly affects user satisfaction, visitor engagement, conversion rates, and even your search engine rankings. By connecting the dots between a fast, reliable website and tangible business outcomes, you can turn performance from a technical chore into a powerful strategic advantage.
The Real-World Impact of Speed
Slow websites don't just annoy people—they actively push them away. The data on this is crystal clear. Speed isn't just a technical detail; it's a core part of the user experience and has a massive impact on your SEO and sales.
Research shows that a tiny one-second delay in page load time can slash page views by 11% and drop customer satisfaction by 16%. Even more staggering, nearly half of all users (47%) will leave a site if it takes longer than two seconds to load. That’s a heavy price to pay for a slow digital storefront. For more stats like this, check out this study on website statistics from Reboot Online.
A fast website isn't a luxury anymore; it's a basic requirement for succeeding online. Benchmarking provides the roadmap you need to spot weaknesses, build on your strengths, and make smart decisions that improve both the user experience and your bottom line.
Turning Insights into Action
The real magic of benchmarking is how it guides your optimization efforts. When you know exactly how you measure up against the competition and where your own bottlenecks are, you can focus on the fixes that will make the biggest difference.
- Set Realistic Goals: Instead of just aiming for a "fast" site, you can set specific, achievable targets based on what the leaders in your space are doing.
- Identify Weaknesses: You can pinpoint the exact culprits slowing you down, whether it's massive images, a slow server, or bloated third-party scripts.
- Measure Progress: It allows you to track your performance over time, proving that your changes are working and that you're heading in the right direction.
Getting a handle on what your benchmarking is trying to accomplish is the first step. For a complete look at how to boost your site's speed and user experience, this guide to website performance optimization is an excellent resource.
You can't improve what you don't measure. When it comes to website performance, vague feelings of "fast" or "slow" just won't cut it. To truly benchmark your site, you need to get familiar with the specific metrics that define the user experience.
Think of these metrics like the vital signs a doctor checks—each one tells you something specific and critical about your website's health.
The big three you absolutely need to know are Google's Core Web Vitals. These aren't just arbitrary numbers; they were specifically designed to measure how a real person experiences your website. They help you see your site through your visitors' eyes.
Understanding The Core Web Vitals
At their heart, the Core Web Vitals measure three distinct phases of a user's journey: how fast the page loads, how quickly they can interact with it, and how stable it is visually.
-
Largest Contentful Paint (LCP): How fast does the main content show up?
LCP pinpoints the moment the largest element—usually a hero image or a big block of text—appears on the screen. This is the closest we can get to measuring that "ah, it's loaded" feeling for a user. A slow LCP is a surefire way to make your site feel sluggish, even if other little bits and pieces load quickly. -
Cumulative Layout Shift (CLS): Does the page jump around while loading?
CLS is all about visual stability. You know that infuriating experience when you go to tap a button, but an ad loads at the last second and pushes it down, causing you to misclick? That’s a layout shift. A high CLS score means your page is unstable and unpredictable, which quickly erodes user trust. -
Interaction to Next Paint (INP): How quickly does the page respond to a click?
INP, which is replacing the older First Input Delay (FID), measures your site’s responsiveness. It tracks the time between someone clicking a button or tapping the screen and seeing a visual response. A long delay here makes a page feel broken or frozen, leaving users clicking over and over in frustration.
Other Vital Performance Indicators
While the Core Web Vitals get most of the attention, a few other metrics are crucial for diagnosing why those scores might be low. They often give you the first clues about where the real problems are hiding.
Time to First Byte (TTFB) is the starting pistol for your entire page load. It measures how long it takes your server to send back the very first piece of information after a request is made. It's a pure test of your server's reaction time.
A slow TTFB is like a restaurant kitchen that takes 10 minutes just to acknowledge your order. No matter how fast the waiters run, your food is already late.
First Contentful Paint (FCP) is the very first sign of life a user sees. It marks the moment anything—text, a logo, a background color—first appears on the blank screen. It's the "okay, something is happening" signal that keeps visitors from bouncing. For online stores, tracking both FCP and LCP is non-negotiable. Dive deeper into our guide on essential ecommerce performance metrics to see what else you should be monitoring.
The bar for performance is set high. According to data from DebugBear, the average US website takes 1.9 seconds to load its main content (LCP) on a mobile device. That load time is built on an average TTFB of around 800 milliseconds and an FCP of about 1.4 seconds. These numbers aren't just trivia; they're the baseline you're competing against.
To help you keep these metrics straight, here’s a quick-reference table that breaks down what each one means and the targets you should be aiming for.
Core Web Vitals and Key Performance Metrics Explained
| Metric | What It Measures | Good Target |
|---|---|---|
| LCP | Time for the largest content element to load. | Under 2.5 seconds |
| INP | How quickly the page responds to user interactions. | Under 200 milliseconds |
| CLS | How much the layout shifts unexpectedly during load. | Score below 0.1 |
| TTFB | Server response time. | Under 800 milliseconds |
| FCP | When the first piece of content appears on screen. | Under 1.8 seconds |
Having a solid grasp of these metrics is the first step. It moves you from guesswork to a data-driven approach, allowing you to pinpoint exactly where your site is falling short and what you need to fix.
How to Benchmark Your Website Performance
Alright, you've got the theory down. Now it's time to roll up our sleeves and put it into practice. Benchmarking your website's performance isn't just some abstract exercise; it's about creating a clear starting line for every optimization effort you make from here on out.
Think of it like this: you wouldn't start a cross-country road trip without a map. Benchmarking is that map. It shows you exactly where you are right now, so you can figure out the best route to where you want to be. The process boils down to setting clear goals, picking the right competitors, creating a stable testing environment, and running your first tests to get that all-important baseline.
Step 1: Define Your Benchmarking Goals
Before you touch a single testing tool, you need to know what you’re aiming for. A vague goal like "make the site faster" is pretty much useless. What you need are specific, measurable targets that actually mean something for your business.
Your goals should be concrete. A great way to start is by looking at your competition. For example, a simple but powerful goal is: "Our product pages should load at least 10% faster than our top three competitors." Right away, that gives you a clear target and an easy way to know if you've succeeded.
Here are a few other examples of solid goals:
- Get a "Good" score (under 2.5 seconds) for Largest Contentful Paint on our key landing pages.
- Bring our Cumulative Layout Shift score below 0.1 to stop elements from jumping around during checkout.
- Improve our server response time (TTFB) so it's consistently under 800 milliseconds.
Step 2: Identify Your Competitors
Picking the right competitors to measure against is critical. You’re not trying to beat Amazon (unless you are Amazon). You want to compare your site against the others who are genuinely vying for the same eyeballs and ranking for the same keywords.
A good rule of thumb is to pick three to five direct competitors. These are the companies you see popping up in search results right next to you. Sizing them up gives you a realistic benchmark for what your shared audience expects. It’s the clearest way to know if you’re leading the pack, just keeping up, or falling behind.
Step 3: Create a Consistent Testing Environment
If you want data you can actually trust, you have to control the variables. It's like a science experiment—if the conditions change with every test, the results are meaningless. When it comes to benchmarking, consistency is everything.
Think of your test environment as your control group. By keeping the conditions identical for every test—for your site and your competitors'—you can be sure that the differences you see are from the websites themselves, not just a random blip in network speed.
To keep things consistent, always use the same settings for every test:
- Location: Pick a test location that reflects where most of your users are.
- Connection Speed: Use a standardized speed, like "Fast 3G," to see how you perform under more realistic mobile conditions.
- Device: Decide if you’re testing for desktop or mobile and stick to it.
This infographic breaks down the Core Web Vitals, which are a cornerstone of measuring user-focused performance in any test you run.
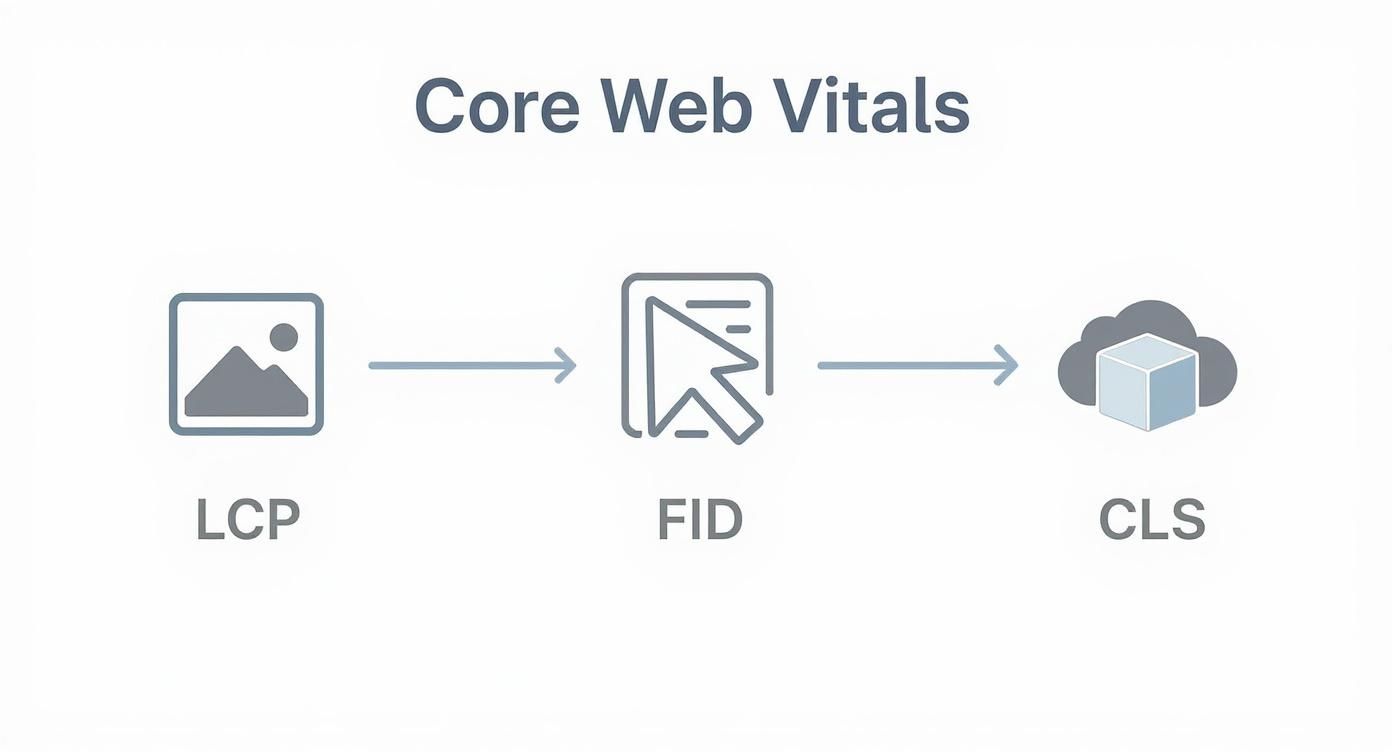
As you can see, LCP covers loading, FID (now INP) handles interactivity, and CLS measures visual stability. Together, they give you a well-rounded view of the user's actual experience.
Step 4: Run and Document Your Baseline Tests
With your goals set, competitors chosen, and environment locked in, it's time to get your hands dirty and gather that baseline data. This first round of measurements is your "before" photo. It's the benchmark that all your future improvements will be measured against.
Grab a performance tool and start testing your most important pages—homepage, product pages, key blog posts—and do the same for the equivalent pages on your competitors' sites. For every single page, run the test three to five times and take the average or median score. This little step is crucial for smoothing out any weird, one-off results and giving you a number you can rely on.
Document everything in a spreadsheet. Seriously, write it all down. Your sheet should track:
- The date you ran the test
- The URL of the page tested
- Which tool you used
- The scores for your key metrics (LCP, INP, CLS, TTFB, FCP)
- Any notes or observations you had
This isn't just a boring list of numbers. This document is the foundation of your entire performance strategy. It’s the hard data you'll use to make the case for improvements, show your progress over time, and ultimately build a faster, better website.
Choosing The Right Benchmarking Tools
Picking the right tools to benchmark your website's performance can feel a bit like standing in a crowded hardware store. There are dozens of options, each promising the best results, and it's easy to get overwhelmed. But the secret is knowing that different tools are built for different jobs—you wouldn't use a sledgehammer to hang a picture frame, right?
The first thing to get your head around is the two main types of performance data: lab data and field data. Understanding the difference is the first and most important step to building a testing strategy that actually works.
Lab Data Tools For Controlled Testing
Think of lab data tools as your controlled experiments. They test your site under consistent, predictable conditions—a specific device, a fixed network speed, and a set location. This is perfect for debugging, running repeatable tests, and seeing exactly how a code change impacts performance before it goes live.
It's a lot like putting a car on a dynamometer. You place it in a controlled environment to measure its horsepower and torque under the exact same conditions every time. This removes all the real-world variables like bumpy roads or bad weather, giving you pure, comparable data.
-
Google Lighthouse: This is probably the most well-known lab tool, and for good reason—it’s built right into Chrome DevTools. It runs a series of audits on your page and spits out scores for performance, accessibility, SEO, and more. It's brilliant for quick, on-the-fly checks.
-
WebPageTest: When you need to go deep, this is your tool. It lets you test from different locations and browsers all over the world, giving you incredibly detailed waterfall charts that show precisely how every single asset on your page loads. It’s the professional-grade diagnostic tool for serious performance tuning.
Here’s a peek at the Google Lighthouse interface. It gives you a clean, color-coded report on all the key metrics.

This report immediately gives you a performance score and flags specific issues with metrics like LCP and CLS, making it easy to see where the problems are.
Field Data Tools For Real-World Insights
Field data, often called Real User Monitoring (RUM), is the other side of the coin. Instead of a sterile lab, it gathers performance data from your actual visitors as they browse your site on their own phones, laptops, and spotty Wi-Fi connections. This gives you a true picture of how your website performs out in the wild.
If lab data is the dyno test, then field data is like installing a GPS tracker and telemetry system in thousands of cars to see how they handle everyday traffic. You see the real-world slowdowns, the random network drops, and the huge variety of user experiences.
Lab data tells you how your website should perform. Field data tells you how it actually performs. You need both for a complete picture.
-
Google Search Console (Core Web Vitals Report): This is one of the easiest ways to get field data. It pulls information from the Chrome User Experience Report (CrUX) to show you how your pages are performing for real people, specifically highlighting your LCP, INP, and CLS scores.
-
PageSpeed Insights: This tool is so useful because it combines both lab and field data. It runs a Lighthouse test (lab) and also pulls in the CrUX data (field) for the page you’re testing, giving you a powerful, two-in-one perspective.
Comparison of Website Performance Benchmarking Tools
Choosing the right tool often comes down to what you're trying to accomplish. Are you debugging a specific issue, or do you need to understand the big picture of your users' experience? This table breaks down some of the most popular tools to help you decide.
| Tool | Best For | Data Type | Cost |
|---|---|---|---|
| Google Lighthouse | Quick, on-demand audits during development and debugging. | Lab | Free |
| WebPageTest | In-depth, granular analysis with detailed waterfall charts. | Lab | Free (with paid options) |
| PageSpeed Insights | Getting a quick, combined view of lab and real-world data. | Lab & Field | Free |
| Google Search Console | Monitoring real-user Core Web Vitals performance over time. | Field | Free |
| GTmetrix | Scheduled monitoring, historical tracking, and performance reports. | Lab | Freemium |
| Pingdom | Uptime monitoring combined with page speed and user monitoring. | Lab & Field | Paid |
Ultimately, a good strategy uses a mix of these tools. You might use Lighthouse daily while coding and then check Search Console weekly to see how your changes impact real users.
All-In-One Monitoring Platforms
For businesses that can't afford to let performance slip, all-in-one platforms are the way to go. These tools typically bundle synthetic testing (lab data) with real user monitoring (field data) and add features like historical tracking, alerts, and even competitor analysis.
-
GTmetrix: A very popular and easy-to-use tool that uses Lighthouse data but presents it with extra insights and historical graphs. It’s great for scheduling tests and tracking performance over time.
-
Pingdom: Best known for its uptime monitoring, Pingdom also provides excellent page speed monitoring from various global locations, helping you keep a constant watch on your site’s health.
The right toolset really just depends on your goals. For a complete walkthrough of building a testing process, you can learn more about how to test website performance in our detailed guide. Most solid strategies end up using a lab tool like Lighthouse during development and a field tool like Search Console to monitor the real-world results.
How to Analyze Your Benchmark Data
Collecting all that data is a great start, but the real work begins when you turn those raw numbers into a clear plan of attack. Think of yourself as a detective. The metrics are your clues, and your mission is to follow them until you find what’s really slowing down your site.
The first step is to give your numbers some context. A 3.1-second LCP doesn’t mean much on its own. Is that good? Is it bad? You’ll only know by comparing it against two key benchmarks: industry standards and your direct competitors.
This simple comparison immediately tells a story. If all your competitors are loading in under 2.5 seconds, your 3.1-second LCP is a glaring problem. On the other hand, if the industry average is closer to four seconds, you’re actually ahead of the curve. This context is what shows you exactly where you stand.
Pinpointing Performance Bottlenecks
Once you’ve spotted a metric that’s lagging, it’s time to dig deeper and find the root cause. A poor score is just a symptom; you need to diagnose the underlying issue. This is where you connect the "what" (the bad number) with the "why" (the technical problem causing it).
A high LCP score, for instance, is like a traffic jam. The jam itself is the problem—a slow load time—but the cause could be anything. Maybe there's a broken-down car (a massive, unoptimized image) or a poorly timed traffic light (inefficient code blocking the page from rendering). Your job is to find that specific cause.
Here are a few common culprits behind poor metrics:
- High LCP: This is often the fault of large, uncompressed images, slow server response times, or resources that block the main content from showing up quickly.
- Poor INP: Usually points to heavy JavaScript that’s tying up the browser, making it sluggish and unresponsive to user clicks or taps.
- High CLS: The usual suspects are images loading without defined dimensions, ads popping into place, or web fonts causing text to suddenly reflow.
By isolating these specific issues, you can move from vague complaints like "the site feels slow" to a precise, fixable problem like "our 2MB hero image is delaying LCP by over a second."
Prioritizing Your Optimization Efforts
With a list of problems in hand, you have to decide where to start. Not all fixes are created equal. The key is to find the "low-hanging fruit"—those changes that will give you the biggest performance jump with the least amount of effort.
A good rule of thumb is to focus on what the user will actually feel. Fixing a minor layout shift is nice, but shaving a full second off your LCP is something visitors will notice immediately. Create a prioritized to-do list based on real-world impact.
Don't feel discouraged if you find issues; even the biggest players struggle. The 2025 SaaS Website Performance Benchmark Report found that only 32% of top SaaS companies, including giants like Microsoft 365, loaded their key content in under three seconds. As you can read in the Catchpoint performance report, this shows there’s a massive opportunity for improvement across the board.
After you've analyzed your data, applying actionable website performance optimization tips is the logical next step. Your analysis gives you the roadmap, telling you exactly where to focus your energy for the best results.
Common Benchmarking Mistakes to Avoid
Even with the best intentions, it's easy to get website benchmarking wrong. Think of it like a science experiment—if your setup is flawed, your results are worthless. Let's walk through the most common pitfalls so you can get a truly accurate picture of your site's performance.
One of the biggest blunders is testing from just one geographic location. If your office is in New York and all your tests run from a local server, your site might look lightning-fast. But what about your customer in Sydney? They could be staring at a blank screen for seconds, all because of latency.

Testing from a single spot gives you a dangerously skewed view and completely ignores the experience of a global audience. Always run your tests from multiple locations that reflect where your customers actually live.
Inconsistent Testing and Tunnel Vision
Another classic mistake is running tests under inconsistent conditions. You can't test your site on a blazing-fast Wi-Fi connection one day and then check a competitor's site on a throttled 3G network the next. The comparison is meaningless.
To get data you can actually trust, every test needs to follow the same script: same location, same connection speed, same device type. Consistency is everything.
Relying on a single tool is another form of tunnel vision. A lab tool like Lighthouse is fantastic for drilling down into technical issues, but it can't tell you how a real person on a spotty mobile connection is actually experiencing your site.
Using only one type of tool gives you an incomplete story. You need both lab data for controlled diagnostics and field data for real-world insights to get the full picture of your website's performance.
This is why a balanced approach, combining both lab and field data, is non-negotiable.
Focusing on the Wrong Metrics
Finally, don't get caught chasing vanity metrics. It's tempting to fixate on a perfect 100/100 performance score, but if your Core Web Vitals are in the red, that shiny score means very little to your users.
Your priority should always be the metrics that directly impact how a visitor perceives your site's speed. Focusing on improving LCP, INP, and CLS delivers real, tangible benefits that users can actually feel—and that's the whole point. For practical steps on how to do this, check out our guide on how to improve website loading speed.
To keep your benchmarking on track, stick to these simple rules:
- Test Globally: Use tools that can simulate visits from different parts of the world.
- Standardize Conditions: Define and stick to a consistent set of testing parameters for every single run.
- Use Multiple Tools: Blend the insights from lab tools (like Lighthouse) with field tools (like Google Search Console).
- Prioritize User Metrics: Put your energy into improving Core Web Vitals and other metrics that reflect the real user experience.
Have Questions? We've Got Answers
When you first dive into website performance, a few questions always seem to pop up. Let's clear the air on some of the most common ones so you can build a solid strategy for a faster site.
How Often Should I Run a Benchmark?
There isn't a single "right" answer here, but a good rule of thumb is to mix regular check-ins with event-based tests.
Think about running a full competitive benchmark every quarter. This keeps you in sync with what's happening in your industry. For your own site, setting up automated tests to run weekly is a fantastic way to spot performance dips before they snowball into bigger issues.
You should also always run a benchmark in these specific situations:
- Before and after a big change, like launching a redesign or moving to a new platform.
- Right after adding a new app or plugin to see exactly what it’s doing to your speed.
- During peak traffic events, like a Black Friday sale, to make sure your site can handle the pressure.
What Can I Do to Improve Site Speed If I’m Not a Developer?
Good news: you don't need to be a coding wizard to make a huge difference. Some of the most significant speed wins come from basic housekeeping and content management.
Believe it or not, the simplest optimizations often have the biggest impact. Things like compressing your images, turning on caching, and getting rid of old plugins can give you an immediate, tangible boost in user experience—no code required.
Here are a few things anyone can tackle:
- Compress Your Images: Before you upload any image, run it through a tool like TinyPNG. It shrinks the file size without sacrificing quality.
- Use Caching: If your site is on a platform like WordPress, a caching plugin is a game-changer. It serves up saved, static versions of your pages, taking a massive load off your server.
- Clean House: Go through your plugins or apps. If you're not using something, deactivate and delete it. Unused plugins are dead weight, adding unnecessary code that slows everything down.
What's the Difference Between Synthetic and Real User Monitoring?
Both are crucial, but they tell you different parts of the story.
Synthetic monitoring is like a controlled lab experiment. It uses automated bots to test your site from a specific location with a consistent connection. It’s perfect for getting clean, repeatable data to track changes over time.
Real User Monitoring (RUM), on the other hand, is data from the wild. It gathers performance metrics from your actual visitors on their unique devices, browsers, and network connections. This "field data" gives you the real-deal picture of what your customers are actually experiencing.
Ready to stop guessing and start optimizing? The experts at E-commerce Dev Group provide comprehensive Shopify performance optimization services to ensure your store is fast, reliable, and ready to convert. Visit us at https://scaleshopfolio.com to get your free performance audit today!