


Before we get our hands dirty with the "how," it's crucial to understand the "why." A slow website isn't just a minor technical glitch; it's a direct hit to your sales, your customer trust, and your search engine rankings. Slow performance actively pushes customers away, increases bounce rates, and tarnishes the brand you've worked so hard to build.
Why Website Performance Is a Game-Changer for Growth
When we talk about testing website performance, it's easy to get lost in the technical weeds. But at its core, this isn't about code—it's about business growth. In the world of ecommerce, every single millisecond matters. A tiny one-second delay in page load time can send your conversion rates plummeting as shoppers get frustrated and head straight to a competitor.
That frustration does more than just cost you a single sale. It leaves a lasting negative impression. On the flip side, a snappy, seamless experience builds confidence and keeps customers coming back. Great performance is more than just speed; it’s a fundamental part of any serious digital transformation roadmap to accelerate business growth.
Think of it this way: performance isn't a one-and-done task you check off a list. It's an ongoing commitment to your customer's experience. A faster site means better engagement, higher search rankings, and a healthier bottom line.
How Speed Connects Directly to Your Search Rankings
Search engines like Google are obsessed with user experience. Back in May 2020, they made this crystal clear by rolling out Core Web Vitals. These aren't just vanity metrics; they are specific, measurable signals that tell Google how good (or bad) the real-world experience is on your site. And yes, they are a major ranking factor.
The three pillars of Core Web Vitals you need to know are:
- Largest Contentful Paint (LCP): How long does it take for the main event on your page—like a hero image or a big block of text—to actually appear?
- First Input Delay (FID): When a user first tries to do something, like click a button, how quickly does your site respond?
- Cumulative Layout Shift (CLS): Does your content jump around while the page is loading, causing users to accidentally click the wrong thing? That's what this measures.
Here's a look at a report from Google's own PageSpeed Insights, a tool that measures these very metrics.
Notice how it gives you separate scores for mobile and desktop? That’s a critical reminder that performance isn't the same across all devices.
The Real-World Impact of Core Web Vitals
Focusing on these metrics delivers tangible results. Take Largest Contentful Paint (LCP), for example. The goal is to get this under 2.5 seconds. From what I've seen, improving LCP by just one second can cut bounce rates by a whopping 10-15%.
It's the same story for First Input Delay (FID). Getting your site's response time under 100 milliseconds has led to an 8% increase in add-to-cart rates for some online stores. These numbers prove that performance testing isn't just for developers; it's a powerful tool for boosting your SEO and driving real sales.
Choosing the Right Performance Testing Tools
Trying to pick the right performance tool can feel overwhelming. There are dozens of them out there, and they all promise to make your site faster. The secret isn't finding one magic tool, but understanding that they fall into two different camps, each answering a very different question about your site's speed. Getting this right from the start is how you end up with data you can actually use.
The two main types are Synthetic Monitoring and Real User Monitoring (RUM). I like to think of it this way: Synthetic Monitoring is your controlled lab experiment. It uses a clean, automated browser from a specific location to test your site. This gives you repeatable, scientific results that are perfect for debugging.
RUM, on the other hand, is like getting feedback from every single person who walks through your digital door. It collects data on their actual, real-world experiences, warts and all.
Synthetic Monitoring: The Lab Test
When most people think of a "website speed test," they're thinking of synthetic tests. You pop your URL into a tool like Google PageSpeed Insights, GTmetrix, or WebPageTest, and it simulates a visit. This is incredibly valuable for setting a baseline and tracking down technical problems before they ever reach your customers.
The real beauty here is consistency. Because the test conditions—like the server location, connection speed, and device—are always the same, you can run tests before and after making a change. Just compressed your images? Run another test. You'll see the precise impact of your work, confirming that your fixes are actually, well, fixing things.
My Pro Tip: Never, ever trust a single test result. I always run a test at least three times and take the median score. A one-off test can easily be skewed by a random network hiccup, sending you on a wild goose chase. Consistency is your best friend when you're playing detective with performance issues.
These tools arm you with the detailed diagnostics you need for a deep dive. You'll get access to things like:
- Waterfall Charts: These show you, file by file, how your page loads. It’s hands down the best way to spot a bottleneck, like a rogue script that’s holding everything else up.
- Filmstrip Views: This gives you a frame-by-frame replay of your page loading from a user's point of view. It helps you understand perceived performance—seeing exactly when your hero banner or "Add to Cart" button pops into view.
- Core Web Vitals Scores: You get direct feedback on the metrics Google cares about for ranking, like LCP and CLS. This helps you focus your efforts where they'll have the biggest impact on your SEO.
Real User Monitoring: The Field Report
Lab tests are fantastic for debugging, but they can't capture the messy reality of your audience. That's where Real User Monitoring (RUM) shines. RUM tools collect performance data directly from your visitors' browsers, giving you a priceless look at how your site performs for real people across different countries, networks, and devices.
This is the data that tells you what’s really going on. You might discover your site is blazing fast for someone on fiber in New York but painfully slow for a customer on a 4G network in rural Australia. Without RUM, you'd be completely in the dark.
For a truly complete picture, you need both. Use RUM to spot the broad performance trends that are actually affecting your customers. Then, jump into your synthetic tools to replicate and squash those specific bugs in a controlled environment.
If you want to dig deeper, this guide on the 12 Best Website Performance Monitoring Tools is a great resource. It breaks down the top options to help you find a perfect match for your specific goals.
For most Shopify store owners, the best place to start is with a free synthetic tool. Here’s a quick comparison to help you choose the right one for the job.
Comparison of Top Website Performance Testing Tools
This table breaks down some of the most popular free tools. While they all measure speed, they each have their own strengths, so picking the right one depends on what you're trying to accomplish.
| Tool | Best For | Key Feature | Cost |
|---|---|---|---|
| Google PageSpeed Insights | Quick audits & Core Web Vitals checks. | Provides both lab and field data (if available) for a holistic view. | Free |
| GTmetrix | Beginners who need clear, actionable recommendations. | Prioritizes optimization suggestions with an easy-to-understand grade. | Free & Paid Plans |
| WebPageTest | Advanced users who need deep, granular details. | Highly configurable tests with filmstrips and advanced diagnostics. | Free & Paid Plans |
Ultimately, you can't go wrong starting with any of these. The most important step is simply to start testing, establish a baseline, and get familiar with how your site actually performs.
Understanding the Performance Metrics That Actually Matter
Running a performance test is only half the job. The real magic happens when you can understand the story the numbers are telling you. Honestly, a report crammed with acronyms and milliseconds is pretty useless without some context. Let's break down the most important metrics so you can figure out exactly what’s holding your site back.
We've moved beyond just talking about "load time." Modern performance analysis is all about user-centric metrics that measure how the loading process feels to a real person. Making this mental shift from purely technical stats to experiential data is the key to making improvements that people will notice.
Time to First Byte (TTFB)
Think of Time to First Byte (TTFB) as the starting gun for your page load. It’s the time that passes from when a visitor's browser requests your site to the moment it gets the very first byte of data back from your server. A long TTFB is that dreaded moment of staring at a blank white screen, wondering if anything is happening.
This initial delay is critical because nothing else can start loading until that first byte arrives. It's a foundational metric that gives you a read on your server's health, network latency, and backend efficiency. For a Shopify store, a high TTFB might point to an overloaded server or slow database queries. I've found that a TTFB under 200 milliseconds is the sweet spot; it gives users the sense that the site is instantly responding.
What it tells you: Is my server slow to respond?
Why it matters: It sets the pace for the entire page load. A slow start almost guarantees a slow finish.
Good score: Under 200ms is fantastic. Anything over 600ms needs immediate attention.
Largest Contentful Paint (LCP)
Largest Contentful Paint (LCP) is one of Google's Core Web Vitals, and in my experience, it’s the most important metric for perceived speed. LCP measures how long it takes for the largest element—usually a hero image, video, or a big chunk of text—to appear on the screen.
Simply put, LCP tells the user, "Yes, you're in the right place, and useful content is coming." A fast LCP reassures them, while a slow one is a top reason people hit the back button.
For an e-commerce site, the LCP element is almost always the main product image or a big promotional banner. If that takes forever to show up, you’re losing customer patience and trust before they even see the "Add to Cart" button. This is just one of many important metrics; for a complete picture, take a look at our guide on how to track Shopify store performance metrics.
Cumulative Layout Shift (CLS)
You know that infuriating moment when you try to click a button, but an ad loads at the last second, and you click the ad instead? That's a layout shift. Cumulative Layout Shift (CLS) is the metric that quantifies how much your page content jumps around unexpectedly while it loads.
CLS is all about visual stability. A low CLS score means your page loads predictably and smoothly. A high score means it’s a jarring, frustrating experience that can easily cause mis-clicks and make users want to throw their device across the room.
Common culprits for a bad CLS score include:
- Images that load without their dimensions being set in the code.
- Ads, banners, or other embeds that pop into place after the initial content.
- Web fonts that cause a flash of resized text as they load.
Speed Index and Waterfall Charts
While LCP focuses on one major element, Speed Index gives you a broader picture of the loading experience. It measures how quickly the content in the visible part of the screen (the "above-the-fold" area) is filled in. Two pages might finish loading at the same time, but the one that populates the screen faster will have a better Speed Index and simply feel quicker to the user.
To really get to the bottom of these scores, you have to learn how to read a waterfall chart. This chart is your best friend for diagnostics. It visualizes every single file your browser downloads to build the page, showing them in the exact order they were requested. It’s the ultimate tool for spotting the bottlenecks, like that one massive image or a slow third-party script that’s jamming up the whole process.
How to Run Your First Meaningful Performance Test
Alright, you've got the lingo down and know which tools to use. Now comes the fun part: putting it all into practice. Let's be honest, just plugging your URL into a tool and hitting "Go" is easy, but it won't give you the insights that actually make a difference.
The real goal here is to get inside the head of your customer. We need to configure these tests to mirror how they actually experience your Shopify store. This is how you move from staring at generic scores to finding specific, fixable problems that are costing you sales.
Setting Up a Realistic Test Environment
First things first, stop and think about your ideal customer. Where do they live? Are they scrolling on their phone while waiting for a coffee, or are they browsing on a high-end desktop at home? Running a single test from a server in Virginia with a lightning-fast connection is pretty much useless if most of your shoppers are in California on a spotty 4G connection.
To get data you can actually trust, you need to dial in your test settings.
- Test Location: This is a big one. Always pick a test server location that's as close as possible to where most of your customers are. If you sell primarily in the UK, don't test from the US. It's that simple.
- Browser Selection: Chrome is usually a safe bet, but check your own analytics. If you have a ton of traffic from Safari or Firefox users, you absolutely should run tests on those browsers, too.
- Connection Speed: This might be the most critical and overlooked setting. It's tempting to test on a super-fast "Cable" connection, but that’s not reality for most people. Instead, throttle it down. Choose something more realistic like 4G or even "Slow 3G" to see the painful truth of how your site performs when network conditions aren't perfect.
Crucial Takeaway: A single performance test is just a snapshot in time. Network conditions can be fickle. To get a reliable baseline, you have to run every test at least three to five times and take the median (the middle) result. This simple step prevents a random network hiccup from sending you on a wild goose chase.
Test on a Staging Server First
Here’s a pro tip that will save you a world of headaches: always test performance tweaks on a staging server before they ever see the light of day on your live store. A staging site is just a private copy of your store. It's your personal sandbox where you can experiment with new apps, theme changes, or custom code without any risk to your live traffic or sales.
This gives you a clean, controlled environment to run before-and-after tests. You can install that new review app and see exactly how it impacts your load times without any other variables muddying the waters. If you're new to this, a staging site is the perfect place to learn and experiment without the fear of breaking something. For dropshippers, it's also a great way to test how different supplier integrations affect speed. You can find more ideas in our guide on Shopify dropshipping strategies.
This image breaks down the key steps to follow when you're setting up your performance test.
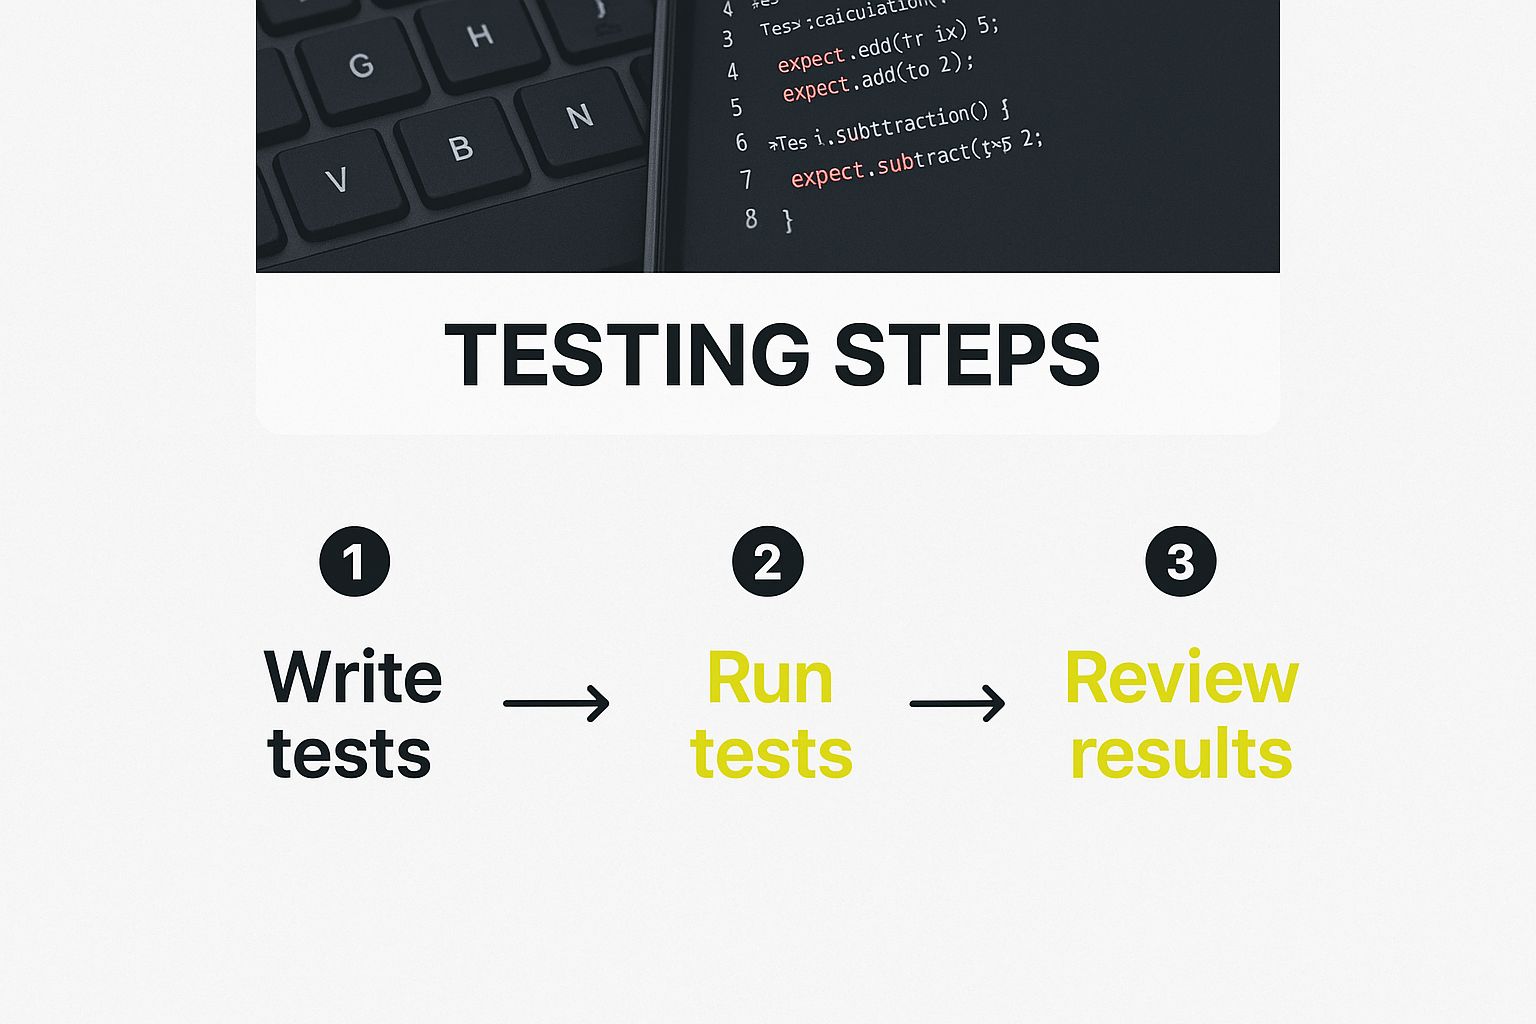
Think of this as your cheat sheet—from picking the right location to analyzing the final report, it covers the entire testing cycle.
Simulate Real User Journeys
Finally, don't just test your homepage over and over. Your customers don't just land on your homepage and stop; they follow a path. A truly meaningful performance test replicates these critical journeys. For any e-commerce store, the most important path is from discovering a product to completing the checkout.
And it’s non-negotiable to test across different devices. Performance can vary wildly. For example, recent data shows that in the US, mobile devices take about 1.9 seconds to load the main content, whereas desktops are a bit quicker at 1.7 seconds. You need to simulate these different device types and network speeds to find the bottlenecks that frustrate real users and kill conversions. You can get more details from this deep dive into website speed data.
By testing these multi-step flows, you’re making sure your entire sales funnel is fast and frictionless—not just the front door.
Turning Your Test Results Into Actionable Fixes
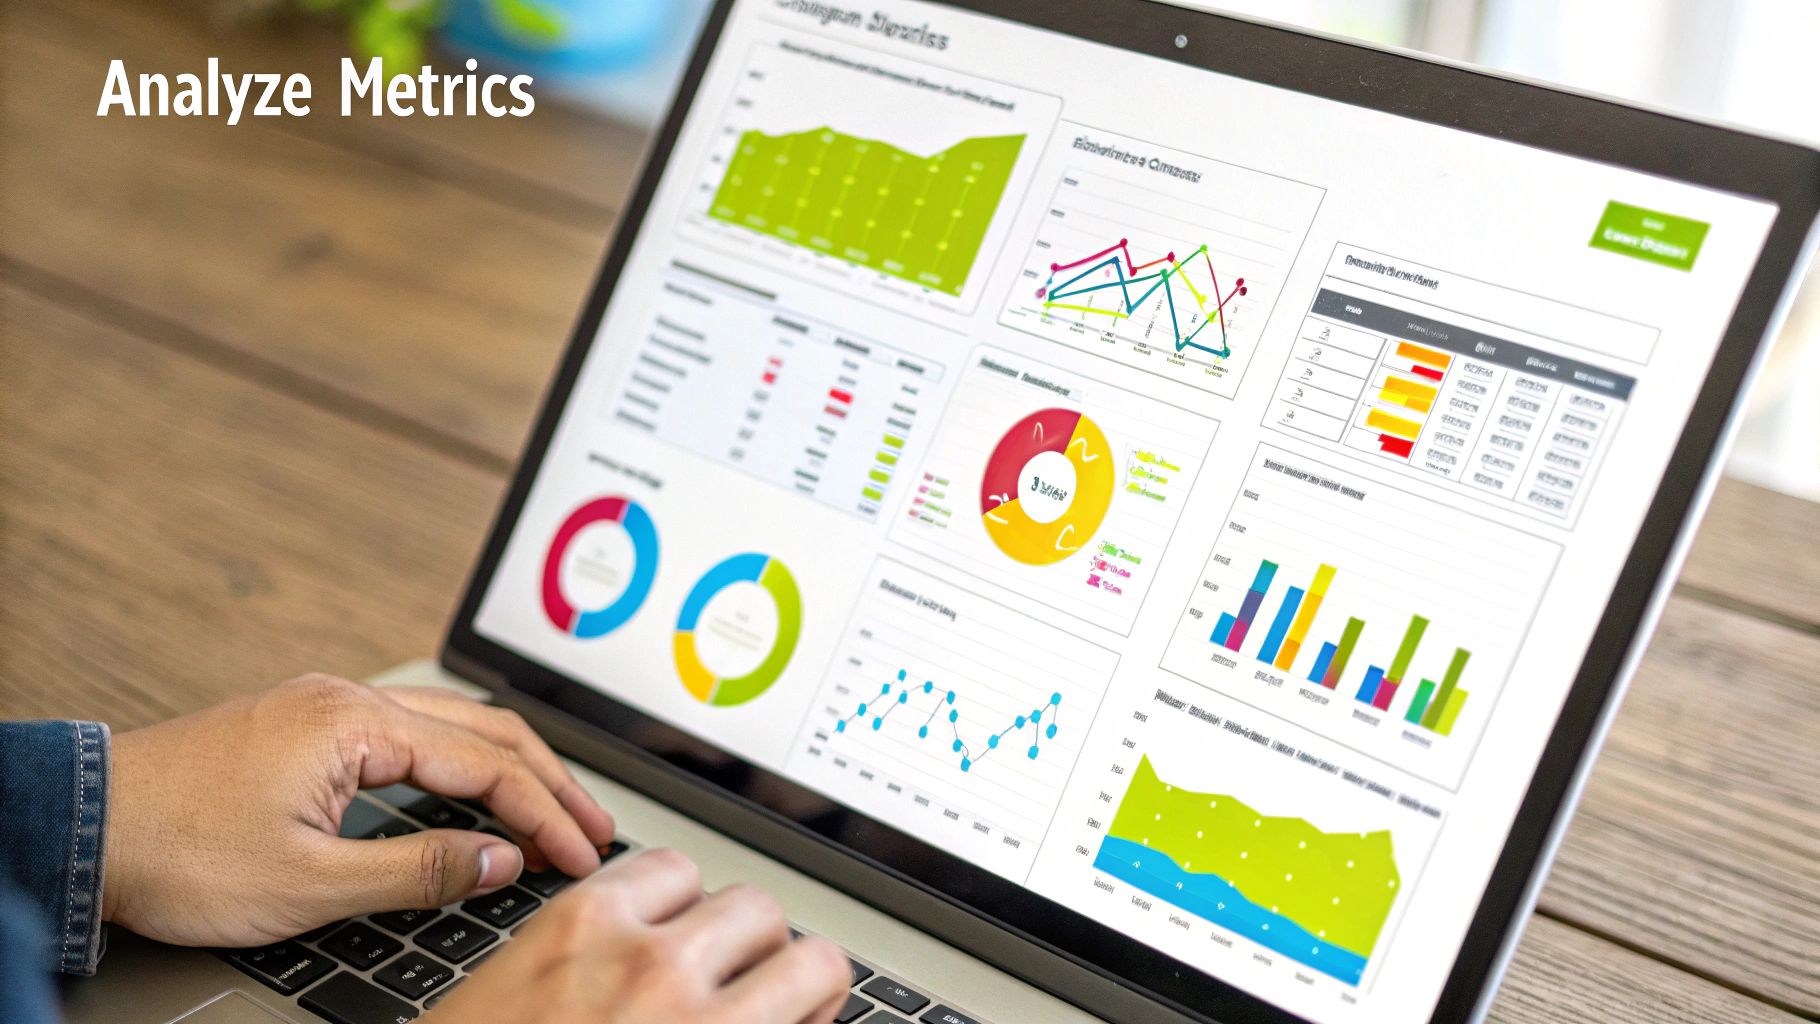
Alright, so you've run the tests. You’re looking at a report brimming with scores, colorful charts, and a long list of warnings. This is the exact spot where most people get overwhelmed and just give up. But a performance report is useless if you don't act on it.
Let's break down how to turn that data into real, tangible speed improvements for your Shopify store.
The trick is to avoid trying to fix everything at once. We’re going to hunt for the "low-hanging fruit"—those issues that give you the biggest speed boost for the least amount of work. Think prioritization, not perfection.
Pinpointing the Primary Speed Culprits
Think of your performance report, especially the waterfall chart, as a treasure map. It leads you right to the bottlenecks slowing down your site. As you look it over, you’ll start to see some familiar patterns. Most site speed problems come down to just a handful of common issues.
Here’s what I’m always looking for first:
- Bloated, Unoptimized Images: This is the big one. Almost always. Giant image files are heavy, and they take forever to download, especially on a spotty mobile connection.
- Render-Blocking Resources: These are usually JavaScript and CSS files lurking in the
<head>of your site. A browser has to stop everything and download them completely before it can show your customers anything on the page. That's what causes that frustrating blank white screen. - Slow Server Response Time (TTFB): If your Time to First Byte is high (anything over 600ms is a red flag), it means your server is taking too long to even start sending the page. This could be from sluggish apps, inefficient backend code, or poor hosting.
- Too Many Third-Party Scripts: Every app you install—for reviews, pop-ups, analytics, or live chat—adds its own code. Each one creates another request that can bog down your site and create a potential point of failure.
By scanning your waterfall chart for these specific things, you can build a data-driven to-do list instead of just guessing.
A critical mindset to adopt here is identifying the Minimum Render Time for your site. What are the absolute bare-minimum resources needed to show the content a visitor sees without scrolling? Focus on loading just those first and push everything else back.
Your Prioritized Checklist for Immediate Fixes
Now that you know what's wrong, it's time to get your hands dirty. We'll start with the easiest fixes that have the most impact. This way, you get quick wins and build momentum.
1. Aggressively Optimize Your Images
This is completely non-negotiable. Before you touch anything else, fix your images. And I don’t just mean running them through a compression tool; it requires a bit more strategy.
- Compress Everything: Use a tool like TinyPNG or an automated Shopify app. Your goal is to shrink the file size of every product photo and banner without any noticeable drop in quality.
- Use the Right Format: Use JPEG for photos. Use PNG for simple graphics like logos, especially if they need a transparent background. Better yet, look into next-gen formats like WebP or AVIF, which offer much better compression.
- Serve Responsive Images: This is huge. Your code should serve different image sizes based on the user's screen. There's no reason to load a massive 2000px-wide banner on a small phone screen.
2. Tame Your Code with Minification and Caching
The code files themselves—your HTML, CSS, and JavaScript—can almost always be slimmed down.
- Minify Your Files: Minification strips out all the junk from your code (spaces, comments, line breaks) that a browser doesn't need. This makes the files smaller and faster to download. Many modern Shopify themes handle this automatically, but it’s always worth checking.
- Leverage Browser Caching: Caching is like telling a visitor's browser to keep a local copy of your site's files. The next time they visit, the browser can load those files from its local storage instead of downloading them all over again. It makes for a dramatically faster experience for repeat visitors.
If you're finding these technical steps a bit daunting, our detailed guide on how to fix a slow Shopify website speed walks you through it step-by-step.
Advanced Fixes for a Competitive Edge
Once you’ve nailed the basics, you can move on to the more advanced stuff that separates the fast sites from the truly blazing-fast ones.
-
Implement a Content Delivery Network (CDN): A CDN is a global network of servers that stores copies of your site’s assets (images, CSS, etc.). When a customer visits your store, the CDN serves those files from a server that is physically closest to them. The good news? Shopify includes a world-class CDN on all of its plans, so you get this benefit automatically.
-
Defer or Asynchronously Load JavaScript: For any JavaScript that isn't absolutely critical for the initial page view (like a chat widget), you can change how it loads. Setting a script to
asynclets it download in the background without holding up the rest of the page. This is a game-changer for killing render-blocking resources.
If you want some inspiration on what's possible when you really dig into the data, check out stories of successful performance overhauls, like how Airbnb achieved 150x performance gains by rebuilding their payment system. By methodically applying these fixes, you’ll turn performance testing from a chore into a powerful tool for growing your business.
Answering Your Top Questions About Website Performance
When you first dive into performance testing, it's natural to have a lot of questions. Honestly, it can feel a bit overwhelming. But once you get a handle on a few core ideas, you'll be well on your way to making your site faster. Let's tackle some of the things people ask me about all the time.
How Often Should I Actually Be Testing My Site?
The simple answer is: it depends on how often your site changes.
A good rule of thumb is to run a full performance test right after any major change. Think installing a new app, launching a new feature, or tweaking your theme. Doing this gives you instant feedback on the performance impact of that specific change.
For a more hands-off approach, I highly recommend setting up automated monitoring to run tests daily or weekly. This is a real game-changer. It establishes a clear performance baseline and helps you spot those sneaky, slow-creeping issues before they balloon into a real headache for your customers. If you do nothing else, at least commit to a full performance audit every quarter to keep up with new best practices.
My Take: I always tell clients to stop thinking of performance as a one-and-done task. It’s more like financial bookkeeping for your site's health. Consistent check-ins are what prevent minor slowdowns from becoming a major turnoff for shoppers.
Why Do My Scores Vary So Much Between Tools?
This is probably the most common frustration I hear. You get a 75 on PageSpeed Insights, but GTmetrix gives you a B. What gives? It’s because every tool is essentially running its test from a different "lab."
These differences usually boil down to a few things:
- Test Server Location: A test from a server in Dallas will almost always be faster than one from London if your store is hosted in the US.
- Connection Speed: One tool might simulate a blazing-fast cable connection, while another uses a more realistic (and slower) 4G mobile speed.
- Device Type: You’ll always get different results between a desktop test and a mobile test.
Instead of obsessing over a perfect 100 on any single tool, pay attention to the recommendations they provide. The real value is in the "what to fix" list. For consistency, stick with one primary tool for your regular tracking and use the others to get a second opinion or different insights.
Can I Really Make My Site Faster Without Knowing How to Code?
Yes, you absolutely can. While some of the really deep-level optimizations require a developer, many of the changes that make the biggest difference are surprisingly non-technical.
You can get started with the fundamentals. Always, always, always compress your images before uploading them to Shopify. When picking a theme, look for one that's specifically marketed as lightweight and performance-focused. And be ruthless about the number of apps you install—each one adds baggage to your site. A quality hosting plan and a Content Delivery Network (CDN) also deliver massive speed boosts with very little technical effort on your part.
What's the Difference Between "Lab Data" and "Field Data"?
This is a super important distinction.
Lab data is what you see when you run an on-demand scan with a tool like PageSpeed Insights. It uses a controlled, consistent environment (the same server, same connection speed, etc.) to give you repeatable results. This is fantastic for diagnosing and debugging a specific issue.
Field data, on the other hand, comes from your actual visitors. It’s also known as Real User Monitoring (RUM). This data reflects how your site actually performs for real people on different devices, from different locations, and on varying network qualities. Google's Core Web Vitals are based on this real-world data.
You really need both. Use lab data to find and fix problems, and use field data to understand the true experience your audience is having.
At E-commerce Dev Group, we translate those confusing performance reports into real business growth. If you’re tired of chasing scores and want to see actual improvements in your site speed and sales, our Shopify experts are ready to help. Discover our optimization services and let's build a faster, more profitable store together.
