

Keeping track of your Shopify store’s performance metrics is essential for improving sales, understanding customer behavior, and optimizing marketing efforts. Shopify Analytics provides tools to monitor key metrics like conversion rate, average order value (AOV), customer lifetime value (CLV), cart abandonment rate, and traffic sources. These insights help you:
- Identify top-performing products and peak sales periods.
- Understand customer habits to adjust strategies.
- Evaluate the effectiveness of promotions and campaigns.
- Address operational issues like checkout drop-offs.
Start with Shopify’s built-in tools like the Dashboard, Reports, and Live View for real-time updates. For deeper insights, external tools like Fabric, Polar Analytics, and BeProfit integrate multi-channel data and provide advanced analytics. Regularly reviewing these metrics ensures you can make informed decisions to grow your store.
Important Shopify Metrics to Watch

Conversion Rate
Your store’s conversion rate reveals how effectively you turn visitors into customers. It’s calculated by dividing the number of completed purchases by the total number of visitors, then multiplying by 100 [3]. You can monitor this in the Shopify Analytics dashboard to spot trends and improve areas like:
- Product pages
- Checkout process
- Site navigation
- Mobile usability
Average Order Value (AOV)
AOV reflects the average amount customers spend per transaction, directly influencing revenue without needing extra traffic [3][4]. To find your AOV, divide your total revenue by the number of orders.
Boost AOV by offering product bundles, setting free shipping minimums, upselling products, providing quantity discounts, or suggesting complementary items.
Customer Lifetime Value (CLV)
CLV estimates the total revenue a customer is likely to bring over their relationship with your store [4]. It’s a key metric for focusing on customer retention and identifying your most valuable shoppers.
CLV Formula: AOV × Repeat Purchases × Customer Lifespan
Cart Abandonment Rate
This metric measures how many shoppers add items to their cart but leave without completing the purchase [3][4]. Common reasons for high cart abandonment include unexpected shipping fees, a complicated checkout process, limited payment options, security concerns, or technical glitches.
Traffic Sources
Knowing where your visitors come from helps you allocate your marketing budget wisely and focus on the channels that perform best [3][5]. Shopify Analytics breaks down traffic sources so you can identify which ones drive the most conversions and highest AOV.
For example, if social media brings in high-converting traffic, consider increasing your investment there while fine-tuning underperforming channels.
With these key metrics in mind, let’s dive into how Shopify’s tools can simplify tracking and improving them.
Using Shopify’s Analytics Tools
Shopify Dashboard
The Shopify Dashboard gives you a quick snapshot of your store’s key metrics, updating in real-time to help you spot trends and make fast decisions. It highlights total sales, top-selling products, online store sessions, and order status tracking [2].
For more detailed analysis, Shopify Reports can dive deeper into specific performance areas.
Shopify Reports
Shopify provides nearly 80 report types to help you evaluate your store’s performance [2]. These reports cover areas like sales, customer behavior, inventory, and marketing performance. They can help you track trends, fine-tune campaigns, and manage inventory effectively.
If you have specific business goals, custom reports can zero in on the metrics that matter most to you [2].
Live View
Live View stands out by focusing on real-time activity instead of historical data. It shows visitor actions, cart progress, and purchases as they happen, making it especially useful during sales events or busy shopping periods [2]. For instance, during peak seasons, you can quickly identify and fix checkout issues on the spot.
"Shopify Analytics offers insights into product popularity and sales trends, enabling store owners to identify slow-moving items and ensure timely restocking. This helps prevent overstocking or stockouts, optimizing cash flow" [6].
How To Track And Analyze Sales And Performance Metrics In Shopify
Using External Analytics Tools
For store owners who need detailed insights or multi-channel tracking, external analytics tools can provide features that go beyond Shopify’s built-in capabilities.
Fabric
Fabric provides pre-built e-commerce dashboards that combine data from different sources, uncovering patterns you might otherwise miss. It integrates Shopify data with metrics from social media and email marketing, offering specialized views to track customer acquisition costs, retention rates, and the effectiveness of your marketing campaigns.
Polar Analytics
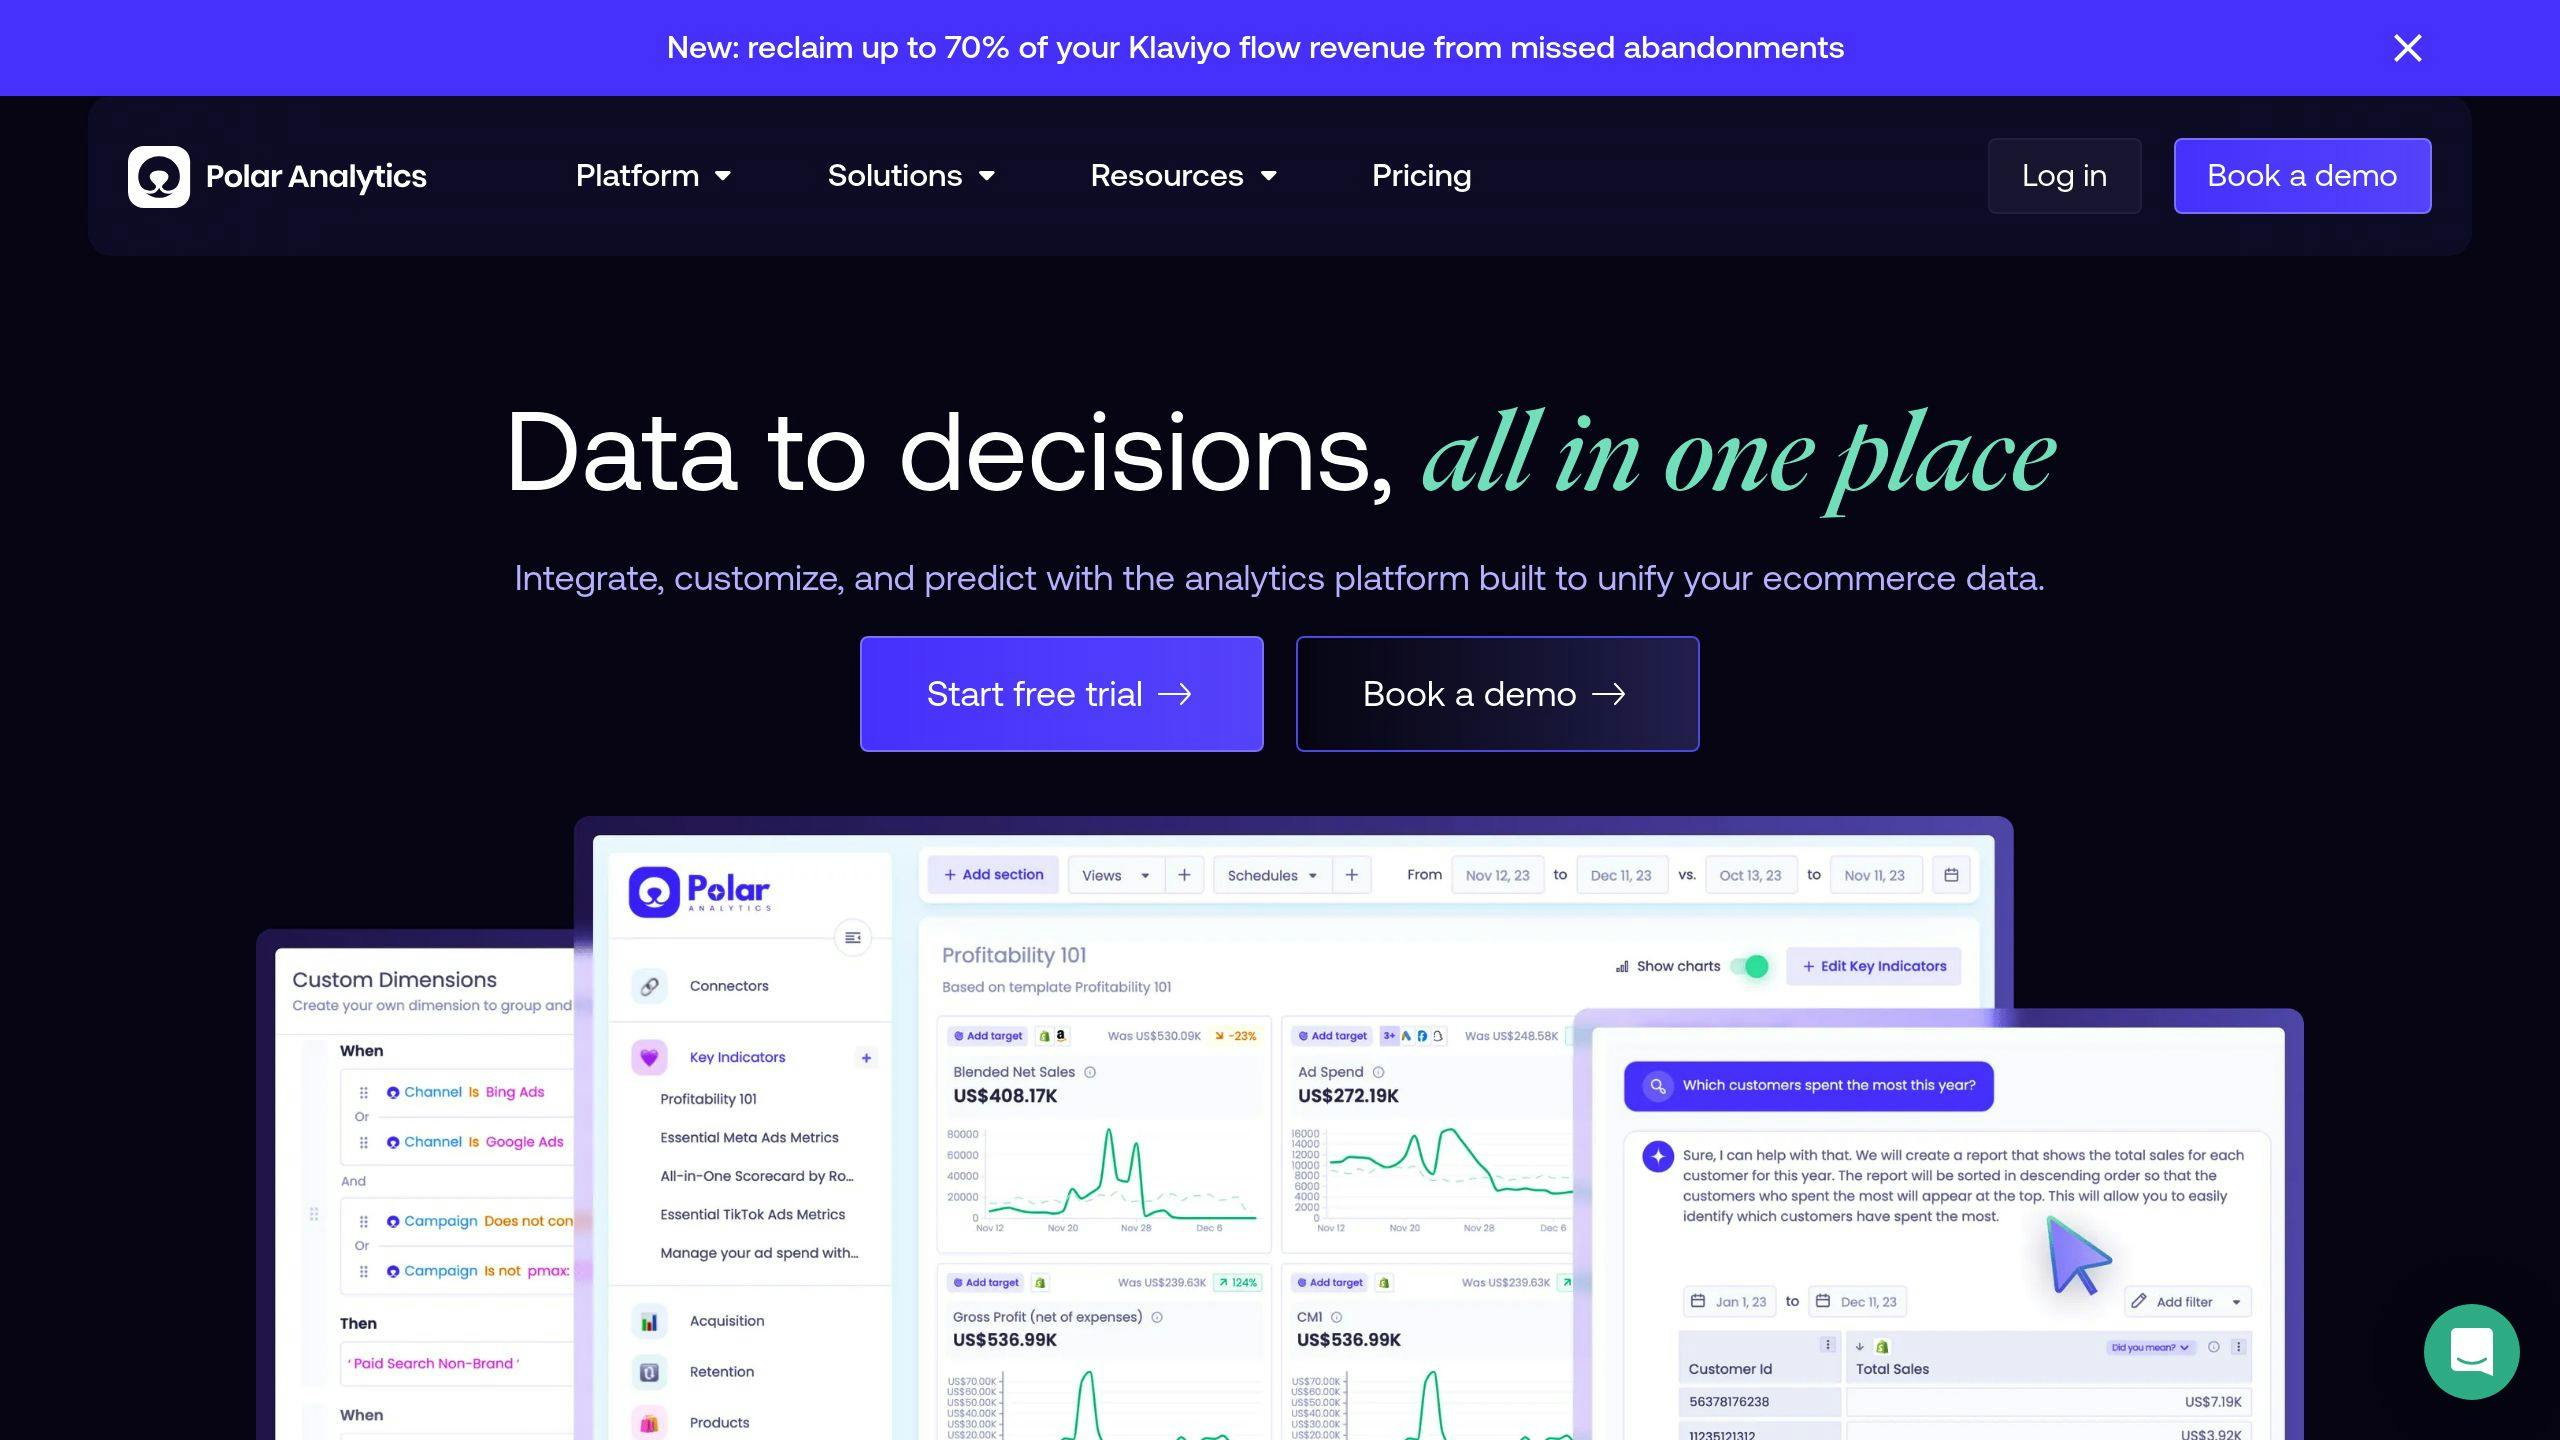
Polar Analytics, starting at $29/month, delivers real-time alerts, goal tracking, and multi-channel data integration. It helps store owners stay on top of key metrics and respond to changes quickly. Some of its standout features include:
| Feature | What It Does |
|---|---|
| Real-time Monitoring | Keeps you updated on sales and goal progress instantly |
| Multi-channel Integration | Combines data from all your marketing channels in one place |
| Custom Dashboards | Lets you track specific KPIs that matter most to your business |
BeProfit
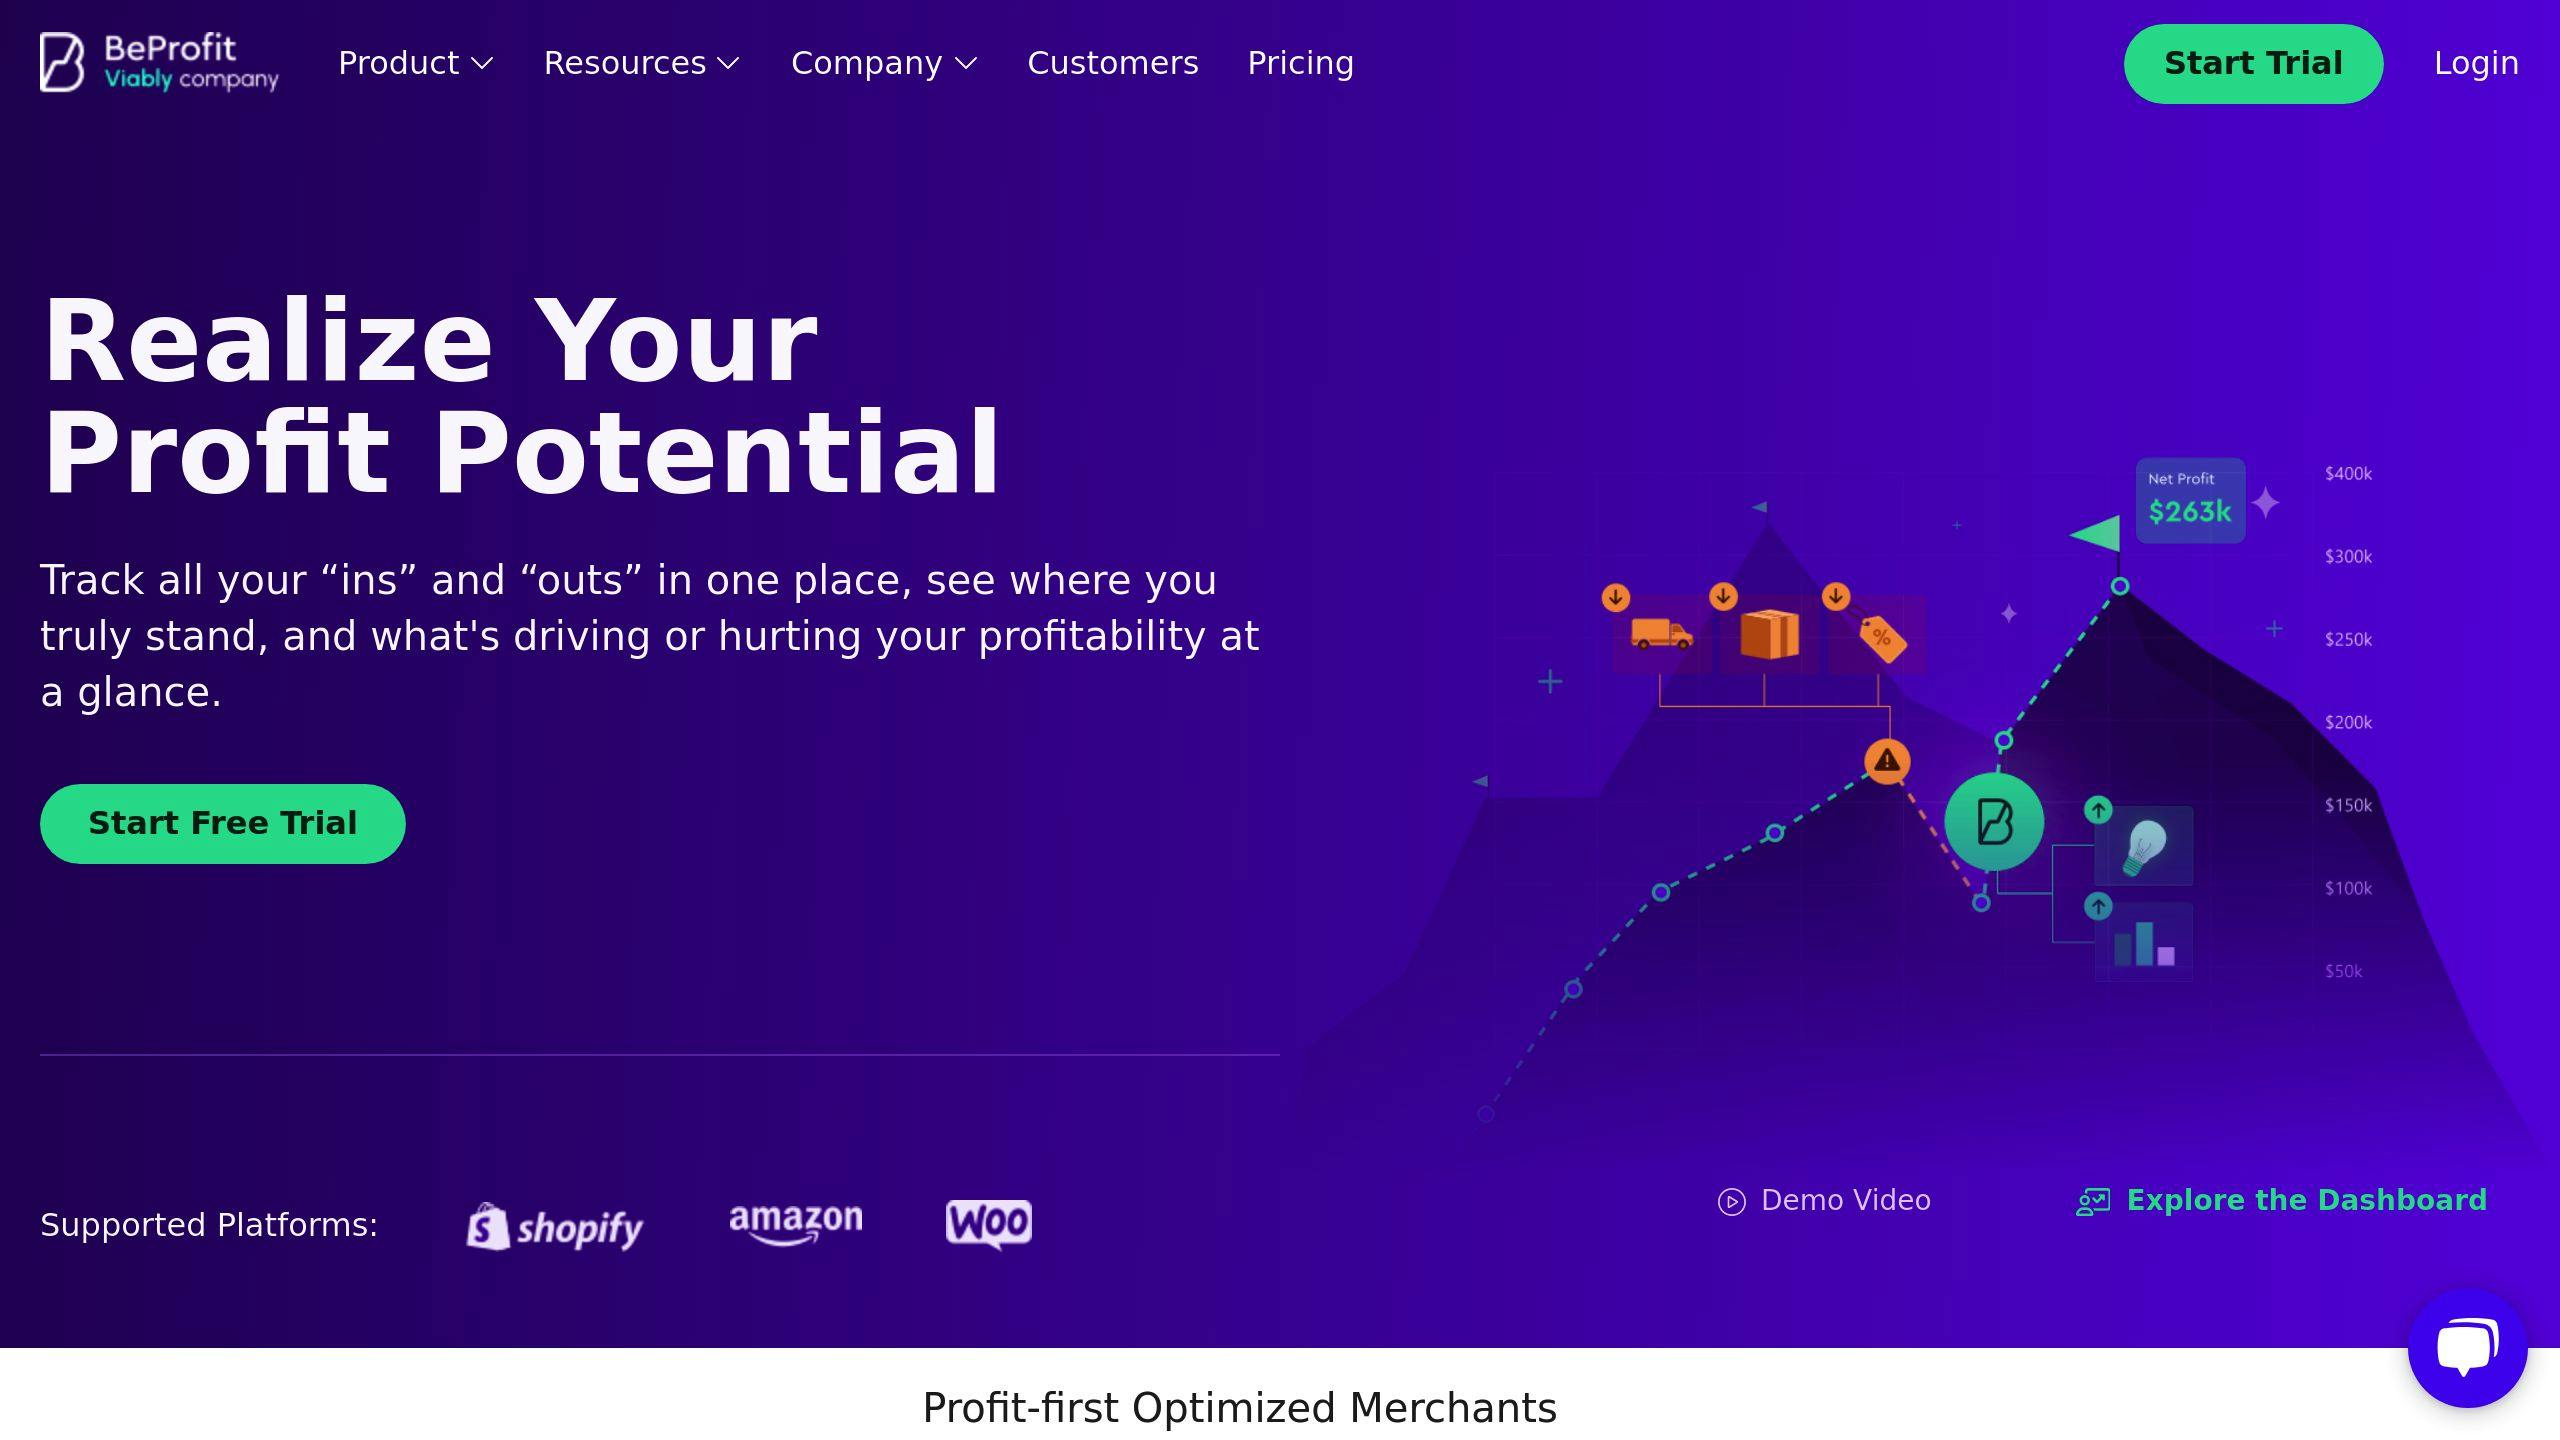
BeProfit focuses on analyzing financial performance and profitability, starting at $25/month. Its dashboard makes it easy to pinpoint high-margin products and costly items, helping you make smarter decisions about inventory and pricing.
"External analytics tools like BeProfit can help identify products with low profit margins or high shipping costs, allowing store owners to adjust their strategies accordingly", says an expert from E-commerce Dev Group’s analytics team.
When choosing an external analytics tool, think about how well it integrates with your store, how easy it is to use, and whether it aligns with your business goals. Many of these tools offer free trials, so you can test them before committing.
Creating and Customizing Shopify Reports
Shopify’s built-in reporting tools provide a straightforward way to analyze your store’s performance without the need for external software. These reports can be adjusted to fit your business goals, saving both time and money.
Key Report Components
Here are the main metrics to include in your Shopify reports:
| Metric Category | Key Components | Purpose |
|---|---|---|
| Sales Performance | Total sales, Net sales, Sales by channel | Track revenue trends and channel effectiveness |
| Customer Insights | Demographics, Purchase behavior, Location data | Understand your audience and their habits |
| Store Activity | Conversion rates, Traffic sources, Active carts | Measure how well your store is performing |
| Product Analysis | Top sellers, Inventory levels, Product returns | Refine and improve product offerings |
Tailoring Reports to Goals
Shopify Analytics offers over 80 report types that can be adjusted to fit specific business objectives [2]. To make the most of these reports:
- Set clear objectives: Focus on metrics aligned with your goals. For example, track repeat purchase rates if you’re aiming to improve customer retention.
- Customize dashboards: Use the ‘Reports’ tab in Shopify to highlight the metrics that matter most to your business [5].
Solving Reporting Challenges
Here’s how to handle common issues with Shopify reporting:
| Challenge | Solution |
|---|---|
| Too much data | Simplify dashboards to display only the most relevant metrics. |
| Difficult analysis | Use charts and graphs to make trends easier to understand. |
| Real-time tracking | Leverage the Live View feature for up-to-the-minute insights. |
For stores managing large amounts of data:
- Apply filters to narrow down results by date range or customer segment [3].
- Build dashboards that focus exclusively on the metrics you care about.
- Use visualization tools to make your data easier to interpret.
If your store requires more advanced reporting capabilities, integrating third-party tools can provide enhanced visuals and automate processes [6]. Shopify’s built-in features, however, are a great starting point for tracking essential metrics without external dependencies.
Conclusion and Next Steps
Keeping track of Shopify metrics is a key part of growing and improving your store. By focusing on indicators like conversion rates, average order value (AOV), customer lifetime value (CLV), and cart abandonment rates, you can make informed decisions that directly boost your revenue.
Start with Shopify’s built-in analytics to get a clear picture of your store’s performance. Once you’re familiar with the basics, consider adding tools like Fabric or Polar Analytics to dig deeper and spot trends you might otherwise miss. Use these insights to plan and prioritize changes aimed at improving your store’s performance.
Here’s a simple timeline to guide your efforts:
- First month: Set up your analytics dashboard and gather baseline data.
- Months 2-3: Look for patterns and pinpoint areas that need improvement.
- Months 4-6: Implement changes based on your findings.
- Ongoing: Regularly review your metrics and adjust your strategies as needed.
If you’re not sure where to start or want to ensure your efforts are as effective as possible, expert advice can make a big difference. Services like those offered by E-commerce Dev Group can help you identify weak spots and turn your data into actionable steps for better performance.
FAQs
Here are answers to some common questions about monitoring Shopify metrics and improving your store’s performance.
How can I check my store’s speed in Shopify?
Shopify provides an Online Store Speed report to help you compare your store’s speed with others. You can find it in your admin panel under Analytics > Online Store Speed. This report updates daily, giving you a clear benchmark.
Which metrics should I focus on tracking?
Here are some key metrics worth monitoring:
| Metric | Importance |
|---|---|
| Conversion Rate | Measures how well visitors turn into customers |
| Average Order Value (AOV) | Tracks the average revenue per transaction |
| Customer Lifetime Value (CLV) | Reflects the total value a customer brings over time |
| Cart Abandonment Rate | Identifies where customers drop off during checkout |
| Traffic Sources | Helps pinpoint which marketing channels drive visitors |
How do I access detailed analytics in Shopify?
To dive into your store’s analytics, go to your Shopify admin panel and click Analytics, then select Dashboard. This section provides an overview of your key performance indicators. For more specific insights, head to the Reports section, where you can create custom reports tailored to your business goals [1][2].
What external tools work well with Shopify’s analytics?
Several third-party tools can expand your analytics capabilities:
- Fabric: Delivers advanced insights into customer behavior
- Polar Analytics: Focuses on conversion tracking and attribution analysis
- BeProfit: Helps with profit tracking and financial reporting
These tools can integrate data from various sources, offering a more detailed view of your store’s performance [2][6].
How often should I review my store’s metrics?
Check sales and traffic daily, evaluate campaign performance weekly, and analyze broader trends monthly. This schedule helps you stay on top of your store’s performance and make timely adjustments.