

Decoding the Metrics That Matter in Ecommerce
Want to boost sales and optimize your online store's performance? You need to track the right ecommerce performance metrics. This detailed guide breaks down 9 essential KPIs every ecommerce business should monitor. We'll equip you with the knowledge and actionable strategies to make data-driven decisions in 2025 and beyond.
This listicle delivers a practical, no-nonsense look at critical ecommerce performance metrics. You'll learn how to calculate them, what industry benchmarks to aim for, and most importantly, how to improve each metric. We'll cover practical strategies for increasing conversions, maximizing customer lifetime value, and optimizing your marketing ROI.
Specifically, we'll explore:
- Conversion Rate: Turning visitors into paying customers.
- Average Order Value (AOV): Increasing revenue per order.
- Customer Acquisition Cost (CAC): Understanding your marketing spend.
- Customer Lifetime Value (CLV/LTV): Measuring long-term customer profitability.
- Cart Abandonment Rate: Recapturing lost sales.
- Return on Advertising Spend (ROAS): Evaluating advertising effectiveness.
- Email Marketing Revenue: Maximizing email campaign performance.
- Website Traffic Quality Score: Attracting the right visitors.
- Mobile Conversion Rate: Optimizing the mobile shopping experience.
Stop guessing and start measuring. Let's dive into the ecommerce performance metrics that drive real results.
1. Conversion Rate
Conversion rate is a cornerstone of ecommerce performance metrics. It represents the percentage of website visitors who complete a desired action. This could be anything from making a purchase and signing up for a newsletter to downloading content. Calculating your conversion rate is simple: divide the number of conversions by the total number of visitors and multiply by 100. This metric is fundamental because it directly reflects how effectively your website transforms visitors into customers.
Understanding key performance indicators is crucial. For a broader perspective on essential metrics, see this article: ecommerce performance metrics from ECORN.
Why Conversion Rate Matters
A high conversion rate signifies a well-optimized website that effectively guides visitors toward desired actions. Conversely, a low rate suggests potential problems in user experience, product offerings, or marketing strategies. Tracking this metric is critical for identifying areas for improvement and maximizing revenue.
Benchmarking and Examples
Industry benchmarks provide valuable context for evaluating your performance. While the average ecommerce conversion rate hovers around 2%, results vary significantly across sectors. For example, Amazon optimizes its product pages to achieve conversion rates of 10-15%, a testament to the power of targeted optimization. Meanwhile, Shopify stores see an average conversion rate of 1.4% across all industries. Fashion retailer ASOS notably improved its conversion rate by 50% through personalization, demonstrating the impact of tailored user experiences.
The following bar chart visualizes conversion rate benchmarks across various product categories:
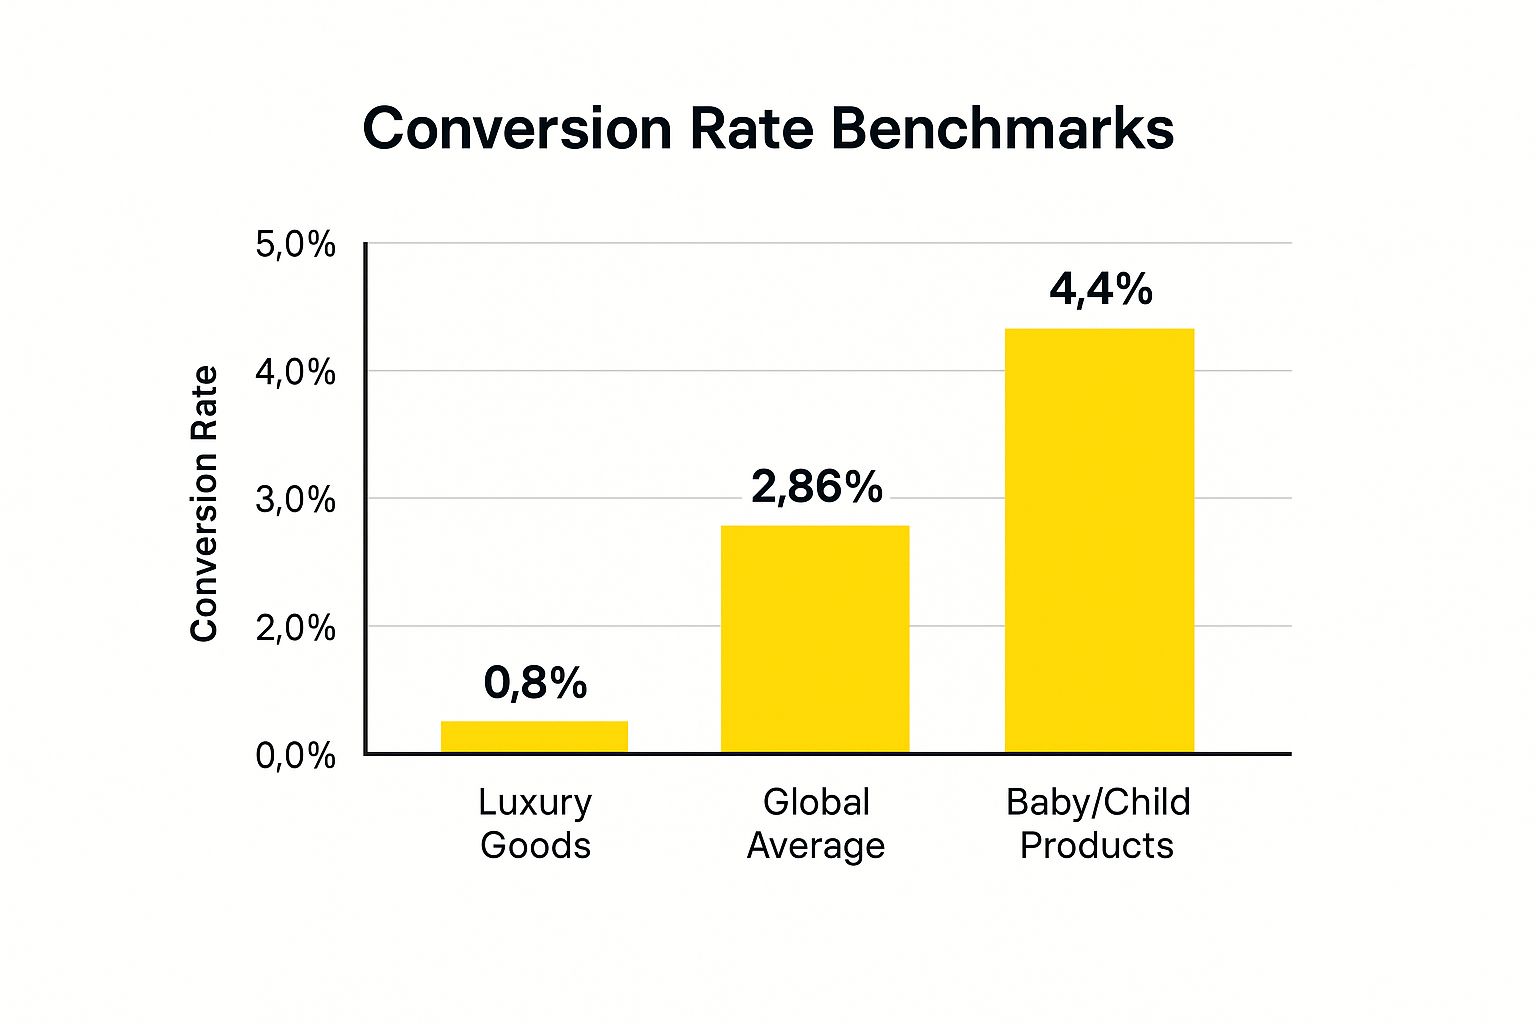
As illustrated, conversion rates can differ significantly. Baby/Child Products boast the highest rate at 4.4%, the Global Average is 2.86%, while Luxury Goods sit at a lower 0.8%. Understanding these benchmarks allows businesses to set realistic targets and identify areas for potential growth.
Actionable Tips for Improvement
Optimizing your conversion rate involves a multi-faceted approach. A/B testing different page elements, such as headlines, call-to-action buttons, and product images, helps pinpoint what resonates best with your target audience. With the rise of mobile commerce, optimizing your site for mobile devices is no longer optional but essential. Utilizing heat mapping tools provides insights into user behavior, revealing where visitors click, scroll, and linger. This information can inform design changes to improve navigation and guide users toward conversions. Implementing exit-intent popups can recapture abandoning visitors with targeted offers or incentives, providing a last chance to secure a conversion.
2. Average Order Value (AOV)
Average Order Value (AOV) is a critical ecommerce performance metric that represents the average dollar amount spent each time a customer places an order. It's calculated by dividing total revenue by the number of orders over a specific time period. AOV provides valuable insights into customer purchasing behavior and is essential for maximizing revenue per transaction. This makes it a key metric for profitability analysis.
Why Average Order Value Matters
Tracking AOV helps businesses understand the effectiveness of their pricing strategies, marketing campaigns, and upselling/cross-selling efforts. Increasing AOV directly impacts profitability, as it allows you to generate more revenue from existing customers without increasing acquisition costs. For a deep dive into conversion optimization, consider this comprehensive guide to Ecommerce Conversion Rate Optimization. Optimizing this metric is crucial for long-term business growth and financial health.
Benchmarking and Examples
While AOV benchmarks vary across industries, observing successful implementations provides valuable insights. Best Buy increased its AOV by 17% through strategic product bundling, offering complementary items at a discounted price. Sephora leverages personalized beauty consultations to boost AOV from $50 to $85, demonstrating the power of tailored customer experiences. Home Depot effectively uses cross-selling initiatives to increase AOV by 23%, recommending related products during the checkout process.
Actionable Tips for Improvement
Several strategies can effectively increase AOV. Implementing product bundling and cross-selling recommendations encourages customers to purchase more items per order. Offering free shipping thresholds above your current AOV incentivizes larger purchases. Volume discounts, such as "buy two, get one free" deals, can also motivate customers to spend more. Finally, creating gift sets and curated collections provides convenient options for higher-value purchases.
3. Customer Acquisition Cost (CAC)
Customer Acquisition Cost (CAC) represents the total cost of gaining a new customer. It encompasses all marketing and sales expenses, divided by the number of new customers acquired within a specific period. Calculating CAC involves summing your marketing and sales costs and dividing that total by the number of customers acquired during the same timeframe. This metric is crucial for evaluating marketing ROI and ensuring sustainable growth by comparing acquisition costs to customer lifetime value (LTV).
Understanding your key ecommerce performance metrics is vital for success. For a broader view of these important metrics, see this related article on ecommerce performance metrics.
Why Customer Acquisition Cost Matters
A high CAC can strain profitability, while a low CAC suggests efficient marketing. Tracking CAC helps businesses optimize spending and allocate resources effectively. By understanding how much it costs to acquire a customer, you can make informed decisions about marketing campaigns and budget allocation. This ensures your marketing efforts contribute to profitability rather than depleting resources.
Benchmarking and Examples
Industry benchmarks for CAC vary significantly based on factors like industry, business model, and customer lifetime value. Dollar Shave Club drastically reduced its CAC by 50% through a viral video marketing campaign that resonated with its target audience. Warby Parker's home try-on program cleverly lowered CAC while simultaneously increasing conversion rates. Casper strategically optimized its CAC across various channels, notably reducing its Facebook CAC from $400 to $200 by refining targeting and ad creatives.
Actionable Tips for Improvement
Improving CAC involves a strategic approach to marketing and sales. Implement multi-touch attribution modeling to gain a comprehensive understanding of your true CAC across different channels. Focus on channels with the lowest CAC and highest LTV for maximum ROI. Optimize landing pages and checkout processes to improve conversion rates, which directly reduces CAC. Implementing referral programs can leverage the power of word-of-mouth marketing to acquire new customers cost-effectively. This organic growth strategy can significantly lower your CAC while building brand loyalty.
4. Customer Lifetime Value (CLV/LTV)
Customer Lifetime Value (CLV or LTV) is a crucial ecommerce performance metric that predicts the total revenue a single customer will generate throughout their relationship with your business. It goes beyond single transactions and considers purchase frequency, average order value, and customer lifespan to provide a holistic view of a customer's worth. This metric is essential for making informed decisions about customer acquisition costs, marketing budgets, and retention strategies.
Understanding key performance indicators is crucial. For a broader perspective on essential metrics for ecommerce, see this article: ecommerce performance metrics from ECORN.
Why Customer Lifetime Value Matters
CLV provides critical insight into the long-term profitability of your customer base. A high CLV indicates strong customer relationships and effective retention strategies. By focusing on increasing CLV, businesses can maximize revenue and build a sustainable customer base. Understanding this metric helps justify marketing spend and optimize resource allocation for customer acquisition and retention initiatives. For those using Shopify, learn more about how to track CLV in Shopify.
Benchmarking and Examples
While CLV benchmarks vary widely across industries, examining successful examples provides valuable context. Starbucks, for instance, calculates its CLV at an impressive $14,099 per customer over 20 years. Amazon has found that Prime members exhibit a CLV twice as high as non-members, highlighting the impact of loyalty programs. Netflix significantly improved its CLV by 75% through personalized content recommendations, demonstrating the power of tailored user experiences.
Actionable Tips for Improvement
Several strategies can effectively boost CLV. Focus your retention efforts on high-CLV customer segments. Implement loyalty programs and exclusive offers to encourage repeat purchases and increase customer lifespan. Use predictive analytics to identify at-risk high-value customers and proactively engage them with targeted interventions. Personalizing customer experiences based on CLV potential can further enhance engagement and drive long-term value.
5. Cart Abandonment Rate
Cart abandonment rate is a critical ecommerce performance metric that measures the percentage of online shoppers who add items to their shopping cart but leave without completing the purchase. It's calculated by dividing the number of completed purchases by the number of initiated shopping carts, then subtracting that result from 100%. This metric highlights friction points within the checkout process and represents immediate revenue recovery opportunities.

Why Cart Abandonment Rate Matters
Tracking cart abandonment rate is crucial for understanding why potential customers are leaving without purchasing. A high rate indicates potential issues with the user experience, checkout process, or website functionality. By identifying and addressing these friction points, businesses can significantly improve their revenue and profitability. This metric provides a direct insight into lost sales opportunities.
Benchmarking and Examples
While cart abandonment rates vary across industries, a global average hovers around 70%. Successfully reducing this rate can have a substantial impact on revenue. Shopify, for instance, reduced its average cart abandonment rate by 18% by simplifying its checkout process. ASOS recovered 20% of abandoned carts through targeted email campaigns, and Zara decreased its abandonment rate by 15% by implementing a guest checkout option.
Actionable Tips for Improvement
Several strategies can help reduce cart abandonment rates and recapture lost sales. Implementing abandoned cart email recovery campaigns is a highly effective tactic. These emails remind customers about the items in their cart and often offer incentives to complete the purchase. Offering a guest checkout option simplifies the process for first-time buyers, reducing friction. Displaying security badges and trust signals can alleviate concerns about online security. Optimizing the checkout experience for mobile devices is essential in today's mobile-first world. Finally, clearly displaying shipping costs early in the buying process helps manage customer expectations and can prevent sticker shock at checkout. For advanced strategies on segmenting users based on their abandonment behavior, you can learn more about cart abandonment segmentation.
6. Return on Advertising Spend (ROAS)
Return on Advertising Spend (ROAS) is a crucial ecommerce performance metric that measures the revenue generated for every dollar spent on advertising. It's calculated by dividing the revenue attributed to your advertising campaigns by the cost of those campaigns. ROAS provides a clear picture of advertising effectiveness and helps optimize marketing budgets. Tracking ROAS is essential for understanding which campaigns are driving the most profitable returns and which need adjustments.
Understanding key performance indicators is crucial. For a broader perspective on essential metrics, see this article: ecommerce performance metrics from ECORN.
Why ROAS Matters
ROAS is vital for assessing the profitability of your advertising efforts. A high ROAS indicates that your campaigns are generating significant revenue for every dollar invested. Conversely, a low ROAS suggests that your campaigns might be inefficient and require optimization. Monitoring this metric helps you allocate resources effectively and maximize your return on investment in advertising.
Benchmarking and Examples
While ROAS benchmarks vary across industries and advertising platforms, understanding average performance provides a helpful starting point. Google Ads typically sees an average ROAS of 2:1 across ecommerce advertisers, meaning for every dollar spent, two dollars are generated in revenue. Facebook advertising for ecommerce often achieves a higher ROAS, around 4:1. However, success stories like Bonobos achieving an 8:1 ROAS through targeted retargeting campaigns demonstrate the potential for significantly higher returns with effective strategies.
Actionable Tips for Improvement
Optimizing ROAS involves continuous testing and refinement. Setting clear ROAS targets based on your profit margins provides a benchmark for success. Utilizing attribution modeling helps accurately measure the contribution of different touchpoints in the customer journey, providing a clearer picture of campaign effectiveness. Testing different ad creatives and audiences allows you to identify what resonates best with your target market. Focusing on high-intent keywords and audiences ensures that your ads are reaching users most likely to convert, maximizing your ROAS.
7. Email Marketing Revenue
Email marketing revenue represents the total income generated directly from email campaigns. This encompasses promotional emails, newsletters, and automated sequences like welcome series and abandoned cart emails. This ecommerce performance metric demonstrates the direct contribution of email marketing to your bottom line, justifying investments and highlighting areas for optimization. Tracking this metric is essential for understanding the effectiveness of your email strategy and its impact on overall revenue.
Understanding key performance indicators is crucial. For a broader perspective on essential metrics, see this article: ecommerce performance metrics from ECORN.
Why Email Marketing Revenue Matters
Monitoring email marketing revenue allows you to assess the ROI of your email efforts. A strong email strategy can drive significant sales and foster customer loyalty. By analyzing this metric, you can pinpoint high-performing campaigns and identify areas needing improvement. Regular audits are essential to ensure ROAS is maximized by reducing wasted spend and optimizing campaign performance. A comprehensive Google Ads audit can provide valuable insights into your campaign performance and identify potential optimization opportunities.
Benchmarking and Examples
Several industry benchmarks highlight the potential of email marketing. Klaviyo users, for instance, typically generate 20-30% of their total revenue from email. Campaign Monitor reports an impressive average email ROI of $42 for every $1 spent. Luxury beauty subscription service Birchbox attributes a substantial 40% of its revenue to email marketing, demonstrating the power of a well-executed strategy.
Actionable Tips for Improvement
Several strategies can enhance your email marketing revenue. Segmenting your email lists allows for targeted messaging, increasing engagement and conversions. Implementing automated email sequences, such as welcome series and abandoned cart reminders, nurtures leads and recovers lost sales. A/B testing subject lines and email content helps identify what resonates best with your audience. Optimizing send times based on your audience's behavior maximizes open and click-through rates. Finally, incorporating personalization into your emails strengthens customer relationships and boosts conversions.
8. Website Traffic Quality Score
Website Traffic Quality Score is a composite metric evaluating the quality of your website visitors. It moves beyond vanity metrics like total visits and focuses on engagement. This involves considering factors like bounce rate, time on site, pages per session, and conversion likelihood. Essentially, it helps differentiate between visitors likely to convert and those who merely inflate traffic numbers without contributing to business outcomes. This is essential for ecommerce performance metrics as it helps focus efforts on attracting and retaining valuable customers.
Understanding the full spectrum of ecommerce performance metrics is crucial for success. For a more detailed guide on key metrics, see this article on ecommerce performance metrics.
Why Website Traffic Quality Score Matters
Focusing solely on visitor volume can be misleading. A high volume of low-quality traffic can create a false sense of success. A strong quality score, however, indicates that your site is attracting engaged users interested in your products or services. This translates to higher conversion rates, improved return on investment (ROI) for marketing campaigns, and ultimately, increased revenue. Tracking quality score allows you to refine your marketing strategies and target the right audience.
Benchmarking and Examples
While there's no universally defined benchmark for website traffic quality score, you can establish internal benchmarks based on your historical data. Platforms like HubSpot offer traffic grading systems that assess lead quality based on various factors. Google Analytics Intelligence also provides insights into traffic quality. Shopify merchants often use bounce rate and session duration as key indicators for quality assessment. Comparing quality scores across different traffic sources can highlight which channels are driving the most valuable visitors.
Actionable Tips for Improvement
Optimizing your website traffic quality score requires a strategic approach. First, weight metrics based on their correlation with conversions. For example, if time on site strongly correlates with purchases, prioritize increasing this metric. Second, compare quality scores across traffic sources to identify high-performing channels. Third, use quality scores to refine ad targeting, focusing on demographics and interests that drive high-quality traffic. Finally, tailor your content strategy to match the patterns observed in high-quality traffic segments, creating a more engaging and relevant user experience. This focus on quality ultimately drives ecommerce success.
9. Mobile Conversion Rate
Mobile conversion rate is a critical ecommerce performance metric specifically tracking the percentage of visitors using smartphones and tablets who complete a desired action, such as making a purchase. With mobile commerce now dominating online shopping, understanding and optimizing the mobile experience is paramount. This often differs significantly from desktop user behavior, making a dedicated mobile conversion rate essential.
Understanding all facets of ecommerce performance metrics is vital for success. For a comprehensive overview of key metrics, explore this insightful article: ecommerce performance metrics from ECORN.
Why Mobile Conversion Rate Matters
Tracking mobile conversion rate allows businesses to identify friction points within the mobile shopping journey. A low mobile conversion rate can indicate issues with site design, page load speed, or checkout complexity, hindering sales and revenue growth. Conversely, a strong mobile conversion rate signals a seamless and engaging mobile experience that caters to on-the-go shoppers.
Benchmarking and Examples
While average ecommerce conversion rates hover around 2%, mobile conversion rates can fluctuate. Many businesses see lower mobile conversion compared to desktop due to smaller screens and potential usability challenges. However, optimizing the mobile experience can dramatically improve these figures. For example, Target improved its mobile conversion rate by 25% through checkout optimization. Nike's mobile app achieves a conversion rate three times higher than its mobile website. Walmart saw its mobile conversion rate soar by 98% after a site redesign focused on mobile-first principles.
Actionable Tips for Improvement
Optimizing mobile conversion rates requires a mobile-first approach. Prioritize page load speed for mobile networks, as slow loading times significantly impact conversions. Simplify the mobile checkout process, minimizing the number of steps and form fields required. Incorporate mobile-specific payment options like Apple Pay for a frictionless experience. Design thumb-friendly navigation and buttons for easy interaction on smaller screens. Learn more about how to optimize your Shopify mobile checkout for conversions.
Ecommerce Metrics Performance Comparison
| Metric | Implementation Complexity 🔄 | Resource Requirements ⚡ | Expected Outcomes 📊 | Ideal Use Cases 💡 | Key Advantages ⭐ |
|---|---|---|---|---|---|
| Conversion Rate | Medium – tracking setup with analytics | Moderate – requires analytics tools | Measures visitor-to-customer effectiveness | Ecommerce performance evaluation | Direct business performance indicator; easy to communicate and segment |
| Average Order Value (AOV) | Low – revenue and order data calculation | Low – uses existing sales data | Revenue maximization per transaction | Pricing, promotion, and revenue growth | Impacts revenue without increasing traffic; easy to influence marketing tactics |
| Customer Acquisition Cost | Medium – tracking and attribution needed | Moderate to high – marketing & sales data | Insights into cost-efficiency of acquisition | Marketing spend optimization | Clear ROI on marketing; essential for scaling profitable growth |
| Customer Lifetime Value | High – complex calculation and prediction | High – needs historical data & analytics | Long-term customer profitability prediction | Retention strategy and acquisition budget | Justifies acquisition cost; guides personalization and retention |
| Cart Abandonment Rate | Low to Medium – checkout funnel tracking | Moderate – requires detailed funnel analytics | Reveals immediate revenue recovery opportunities | Checkout optimization | Direct indicator of lost revenue; quick impact through recovery strategies |
| Return on Advertising Spend | Medium – revenue attribution required | Moderate – marketing and financial data | Advertising campaign profitability | Ad campaign evaluation and budget allocation | Clear ad effectiveness metric; actionable for campaign optimization |
| Email Marketing Revenue | Low – linking email campaign data | Low – email platform data | Measures email channel revenue contribution | Email marketing ROI and campaign scaling | High ROI channel; directly measurable and cost-effective |
| Website Traffic Quality Score | High – composite metric with weighting | High – detailed engagement data & modeling | Evaluates traffic value beyond volume | Traffic source evaluation and marketing spend | Holistic traffic effectiveness view; prevents focus on vanity metrics |
| Mobile Conversion Rate | Medium – device-specific tracking | Moderate – mobile analytics & optimization | Mobile-specific conversion insights | Mobile commerce optimization | Addresses largest traffic segment; critical for mobile UX and conversion gains |
Taking Action: Optimizing Your Ecommerce Performance Metrics
Optimizing your ecommerce performance metrics is crucial for driving sustainable growth. This involves more than just tracking numbers. It requires a strategic approach to data analysis, enabling you to identify areas for improvement, optimize marketing campaigns, and enhance the customer experience. By understanding and acting upon the insights gleaned from these metrics, you can significantly impact your bottom line.
Key Takeaways and Actionable Steps
Throughout this article, we've explored essential ecommerce performance metrics. Let's recap the key takeaways and highlight actionable steps for improvement:
- Conversion Rate: Focus on optimizing your product pages, checkout process, and site navigation to improve conversions. A/B testing different elements can yield valuable insights.
- Average Order Value (AOV): Implement strategies like upselling, cross-selling, and bundled offers to encourage larger purchases.
- Customer Acquisition Cost (CAC): Explore diverse marketing channels and refine your targeting to reduce acquisition costs.
- Customer Lifetime Value (CLV/LTV): Implement loyalty programs and personalized marketing campaigns to maximize customer lifetime value.
- Cart Abandonment Rate: Utilize retargeting emails and abandoned cart recovery strategies to recapture lost sales.
- Return on Advertising Spend (ROAS): Continuously analyze your ad campaigns and adjust bidding strategies to maximize your return on investment.
- Email Marketing Revenue: Segment your email list and personalize your messaging to improve open rates, click-through rates, and ultimately, revenue.
- Website Traffic Quality Score: Focus on attracting high-intent traffic through targeted marketing efforts and SEO optimization.
- Mobile Conversion Rate: Optimize your website for mobile devices to ensure a seamless and user-friendly experience for mobile shoppers.
The Power of Ecommerce Performance Metrics
Mastering these ecommerce performance metrics is vital for any online business. These metrics provide invaluable insights into your business's performance. They allow you to identify strengths, weaknesses, and opportunities for growth. By consistently monitoring and analyzing these KPIs, you can make data-driven decisions that propel your business forward.
Achieving Sustainable Growth Through Data-Driven Decisions
Using data to inform your decisions is key to long-term success in the competitive ecommerce landscape. By leveraging the power of ecommerce performance metrics, you can unlock the full potential of your online store and achieve sustainable growth. This data-driven approach empowers you to adapt to market changes, optimize your strategies, and stay ahead of the curve.
Ready to take your Shopify store's performance to the next level? E-commerce Dev Group offers expert Shopify support, development, and marketing services tailored to optimize your ecommerce performance metrics and drive growth. Visit E-commerce Dev Group to learn more and discover how we can help you unlock your online store’s full potential.