

If your website feels sluggish, the usual suspects are almost always image compression, code minification, and using a Content Delivery Network (CDN). Tackling these head-on addresses the biggest causes of slow load times: bulky files and the physical distance between your server and your visitor. Getting your site to load quickly isn't just a technical trophy; it's a core business necessity that has a real, measurable impact on how people feel about your brand and whether they decide to buy from you.
Why Website Speed Is A Business-Critical Metric

Your website's speed is so much more than a score you get from a testing tool. It's the very first impression you make. Think of it as your digital handshake—it sets the tone for everything that follows. In an age where attention is the most valuable currency, every single millisecond matters. A slow, clunky site is frustrating, and that frustration can easily send potential customers clicking away to a competitor.
This goes beyond simply keeping users happy. The link between how fast your site loads and how successful your business is has been proven time and time again.
The Financial Impact Of Every Second
The data paints a very clear picture of how speed directly affects your revenue. Even small, seemingly insignificant improvements can lead to major financial gains. For example, shaving just 0.1 seconds off your mobile site's load time can boost e-commerce sales by a surprising 8.4%.
On the flip side, the penalties for being slow are severe. A delay of just a single second can cause page views to drop by 11% and slash customer satisfaction by a whopping 16%. If you want to dive deeper into the numbers, these website load time statistics offer a ton of insight into how load times shape user behavior and sales.
Let's be blunt: a slow website is actively losing you money. It could be through lost sales, abandoned shopping carts, or fewer leads. Poor performance is like having a hole in your pocket—revenue is leaking out.
Setting Performance Benchmarks
So, what should you be aiming for? How fast is "fast enough"? Google provides a solid benchmark, recommending that pages should become visible within three seconds. For e-commerce sites, the target is even tighter: under two seconds.
To have any chance of hitting those numbers, you need to be strict about performance. A major factor is your total page weight—the combined size of all the files a browser has to download. You should really try to keep this under 500 KB. That means being deliberate about optimizing every single thing on the page, from the biggest image down to the smallest script.
Key Takeaway: Stop thinking of speed as a tech problem. It's a business metric that directly shapes user satisfaction, conversion rates, and the overall perception of your brand.
A great way to start is by focusing on the changes that give you the biggest bang for your buck. These quick wins can deliver a noticeable speed boost right away, giving you the momentum to tackle more complex optimizations later on.
I've put together a table to highlight some of these high-impact tasks. It breaks down what to do, why it helps, and how much effort it typically takes.
Quick Wins for Website Speed
| Optimization Tactic | Area of Impact | Estimated Difficulty | Potential Speed Gain |
|---|---|---|---|
| Compress Images | Reduces file size of JPG/PNG/WebP | Easy | High |
| Enable Browser Caching | Stores files locally for repeat visitors | Easy | Medium to High |
| Use a CDN | Delivers assets from servers near the user | Easy to Moderate | High |
| Minify CSS/JavaScript | Removes unnecessary characters from code | Moderate | Medium |
Focusing on these areas first ensures your time and effort translate directly into a better experience for your users and, ultimately, better results for your business.
Running a Performance Audit to Find Bottlenecks
Trying to speed up your website without first running a performance audit is like driving in the dark with no headlights. You might get somewhere eventually, but you're more likely to crash. Before you can fix what's slow, you have to pinpoint exactly what's causing the delay. A proper audit moves you from guesswork to a clear, data-driven roadmap for optimization.
This isn't about chasing a perfect 100/100 score on some tool. It’s about understanding the story your data is telling. Tools like Google PageSpeed Insights and GTmetrix are your best friends here, but the real skill is learning to read their reports and find actionable insights.
Choosing Your Performance Audit Tools
When you first dive in, the number of tools can feel a bit overwhelming. For a solid, no-nonsense starting point, I always recommend focusing on two industry standards:
- Google PageSpeed Insights (PSI): This one is non-negotiable. It reports on Core Web Vitals, which are direct ranking factors for Google. Crucially, it gives you both lab data (a controlled test) and field data (real-world user metrics, if your site has enough traffic).
- GTmetrix: This platform provides incredibly detailed reports, including my favorite diagnostic tool: the waterfall chart. This chart visually breaks down every single request your site makes, showing you precisely how long each asset takes to load.
Running a test is simple—just plug in your URL. Turning those results into a concrete to-do list is where the real work begins.
Here’s what a PageSpeed Insights report looks like, highlighting the key performance metrics for both mobile and desktop.
The report immediately splits mobile and desktop scores. Pay close attention to this, because performance can vary dramatically between devices.
This mobile-desktop performance gap is a common and critical issue. We’ve seen mobile pages take an average of 8.6 seconds to load, while their desktop counterparts load in just 2.5 seconds. This contributes to a much higher bounce rate on mobile, which sits around 56.8%. You need tailored strategies to create a better mobile experience, not just a scaled-down desktop one.
Decoding Key Performance Metrics
Your performance report will be flooded with acronyms. Instead of getting lost in the technical jargon, zero in on the metrics that have the biggest impact on user experience.
My Key Takeaway: Forget the overall score for a minute. The individual metrics tell you why your site is slow. Fix those specific problem areas, and the score will take care of itself.
Here are the big three to watch:
- Largest Contentful Paint (LCP): This measures how long it takes for the largest element on the screen (usually a hero image or a big block of text) to become visible. A slow LCP is what makes a page feel like it's taking an eternity to load.
- Time to Interactive (TTI): This marks the point when a page is not only visually ready but also fully responsive to clicks, taps, and scrolls. A long TTI is incredibly frustrating because the page looks ready, but nothing happens when you try to interact with it.
- Cumulative Layout Shift (CLS): This metric tracks visual stability. A high CLS means things are jumping around on the page as it loads—a sure-fire way to make users accidentally click on the wrong button.
If you run an e-commerce site, these audits are essential for finding issues that directly hurt sales. For those on Shopify, a structured approach is even more important. Our guide on how to conduct professional Shopify store audits can walk you through a more platform-specific process.
Using a Waterfall Chart to Find the Culprits
The waterfall chart in GTmetrix is your most powerful diagnostic tool, period. It gives you a cascading view of every single file your browser has to download to render the page—from HTML and CSS to images and third-party scripts.
By analyzing this chart, you can spot the exact files creating bottlenecks. Look for long bars, which indicate huge files that take forever to download. Also, keep an eye out for gaps or long "wait" times, which might point to a slow server or database query.
Optimizing Images and Media Without Losing Quality

If your performance audit flagged heavy images and media files, you’re in good company. This is easily one of the most common culprits behind a slow website. These large files pack on serious weight, forcing visitors to sit and wait while their browser struggles to download everything.
The great news? This is also one of the easiest issues to fix, and it often delivers the most dramatic speed improvements. The goal isn't to sacrifice visual quality but to be much smarter and more efficient about how you handle your media.
Choosing the Right Image Format
Before you even touch a compression tool, your first step should always be picking the right file format. Using the wrong one means you're starting with a file that's already bloated. Each format was built for a specific job.
Here’s a quick rundown of the main players you’ll be working with:
- JPEG (or JPG): Your workhorse for photographs and any image with complex colors and gradients. It uses lossy compression, meaning it smartly removes some data to shrink the file size. You can often get away with a surprising level of compression before you'd ever notice a difference.
- PNG: Perfect for logos, icons, and any graphics that need sharp lines, text, or a transparent background. PNG uses lossless compression, keeping every bit of original data. This preserves quality perfectly but usually results in a larger file than a comparable JPEG.
- WebP: This is the modern format you should be defaulting to whenever you can. Developed by Google, WebP handles both lossy and lossless compression and can produce files that are significantly smaller than JPEGs or PNGs—often 25-34% smaller with no visible drop in quality. It’s now supported by all major browsers.
Simply choosing the right format from the start can shave off a surprising amount of page weight before you do anything else.
Key Insight: Don’t just save everything as a JPEG out of habit. Switching to WebP for photos and using PNGs only for graphics requiring transparency is a simple but powerful strategy that can improve loading speed almost instantly.
Mastering Image Compression
Once you’ve got the right format, it's time to compress. This is where we shrink the file size even further. There are two main ways to do this, and knowing the difference is key to getting great results.
Lossy vs. Lossless Compression
| Compression Type | How It Works | Best For |
|---|---|---|
| Lossy | Permanently removes some data from the file. Offers significant size reduction. | Photographs and complex images (JPEG, WebP). |
| Lossless | Compresses data without removing any information. The original can be restored. | Graphics needing high fidelity (PNG, GIF, WebP). |
For most websites, a touch of lossy compression on your photos is the sweet spot. You can use tools like Squoosh or ImageOptim to see the changes in real-time, or rely on plugins for platforms like WordPress or Shopify to automate it. To get a much deeper understanding of the techniques involved, check out a professional's guide to smarter file compression.
Implementing Lazy Loading
Even perfectly optimized images can slow down a page if there are too many of them. This is where lazy loading becomes your secret weapon.
Instead of forcing the browser to download every single image when the page first loads, lazy loading tells it to wait. It only loads images as the user scrolls down and gets close to them.
This simple change has a massive impact on the initial load time and metrics like LCP because the browser can focus its resources on rendering what the user sees first. Most modern content management systems and frameworks have lazy loading built-in or available through a simple plugin. It's one of the most effective ways to make a media-heavy page feel lightning-fast.
How to Streamline Code and Eliminate Bloat
https://www.youtube.com/embed/Dyu_wK2uNP0
After you’ve tackled heavy images, the next big speed culprit is almost always the code itself. Every plugin, theme, and third-party script you add to your site piles on more HTML, CSS, and JavaScript. Before you know it, you’ve got a tangled mess that makes browsers work overtime just to render your page.
Think of it like packing for a trip. You wouldn’t stuff three different suitcases if you could fit everything into one tidy carry-on. We’re applying that same logic here—giving the browser fewer, smaller files to deal with.
Minify Your Code to Shrink File Sizes
The first and easiest win is minification. This is a simple but powerful process where you strip out all the characters that are useless to a browser. We’re talking about all the spaces, comments, and line breaks that developers use to keep code readable.
- HTML Minification: Cleans up your page structure by removing extra white space and comments.
- CSS Minification: Does the same for your stylesheets.
- JavaScript Minification: This is where you often see the biggest savings, cutting down the size of your script files.
Getting rid of this digital clutter can make your files significantly smaller, which means they download faster. The good news is you don’t need to be a developer to do this; most caching plugins and modern web development tools can minify your code with the flick of a switch.
This one tweak can have a surprisingly big impact. Users have very little patience for slow sites—research shows that 47% of people expect a page to load in two seconds or less. And for e-commerce, when load time creeps up from two to five seconds, the bounce rate can explode from 6% to a staggering 38%. You can dig into more of these crucial website statistics to see just how much speed matters.
Combine Files to Reduce Server Requests
Once your code is lean, the next step is to bundle it up. This is often called concatenation, and it’s the practice of merging multiple CSS or JavaScript files into one. Why bother? Because every single file your site needs requires a separate round trip to your server, known as an HTTP request.
Fewer requests mean less back-and-forth chatter between the browser and the server, which directly speeds up how quickly your page loads. Instead of asking for ten small JavaScript files one after another, the browser can just grab one bigger file in a single request.
A Quick Tip from Experience: This is a bit of a balancing act. Years ago, the best practice was to combine everything into one massive file. But with modern server technology like HTTP/2, browsers can handle multiple small requests much more efficiently. I usually find a hybrid approach works best—combine your essential, sitewide files, but let page-specific scripts load on their own.
Defer JavaScript That Isn't Critical
Let’s be honest: not every script on your page is essential for the initial view. Things like social media widgets, pop-up chat boxes, or even your analytics tracker don’t need to load right away. But by default, they’re often render-blocking, meaning the browser stops loading anything else until these scripts are downloaded and processed.
The fix is to defer them. By adding a simple defer attribute to the script tag, you’re essentially telling the browser, "Go ahead and download this file, but please wait to run it until the main content of the page is visible."
This is an absolute game-changer for improving what your users actually experience. It helps your most important visual content appear almost instantly, which is key for metrics like Largest Contentful Paint (LCP). Your visitor gets what they came for right away, while the less-important stuff loads quietly in the background.
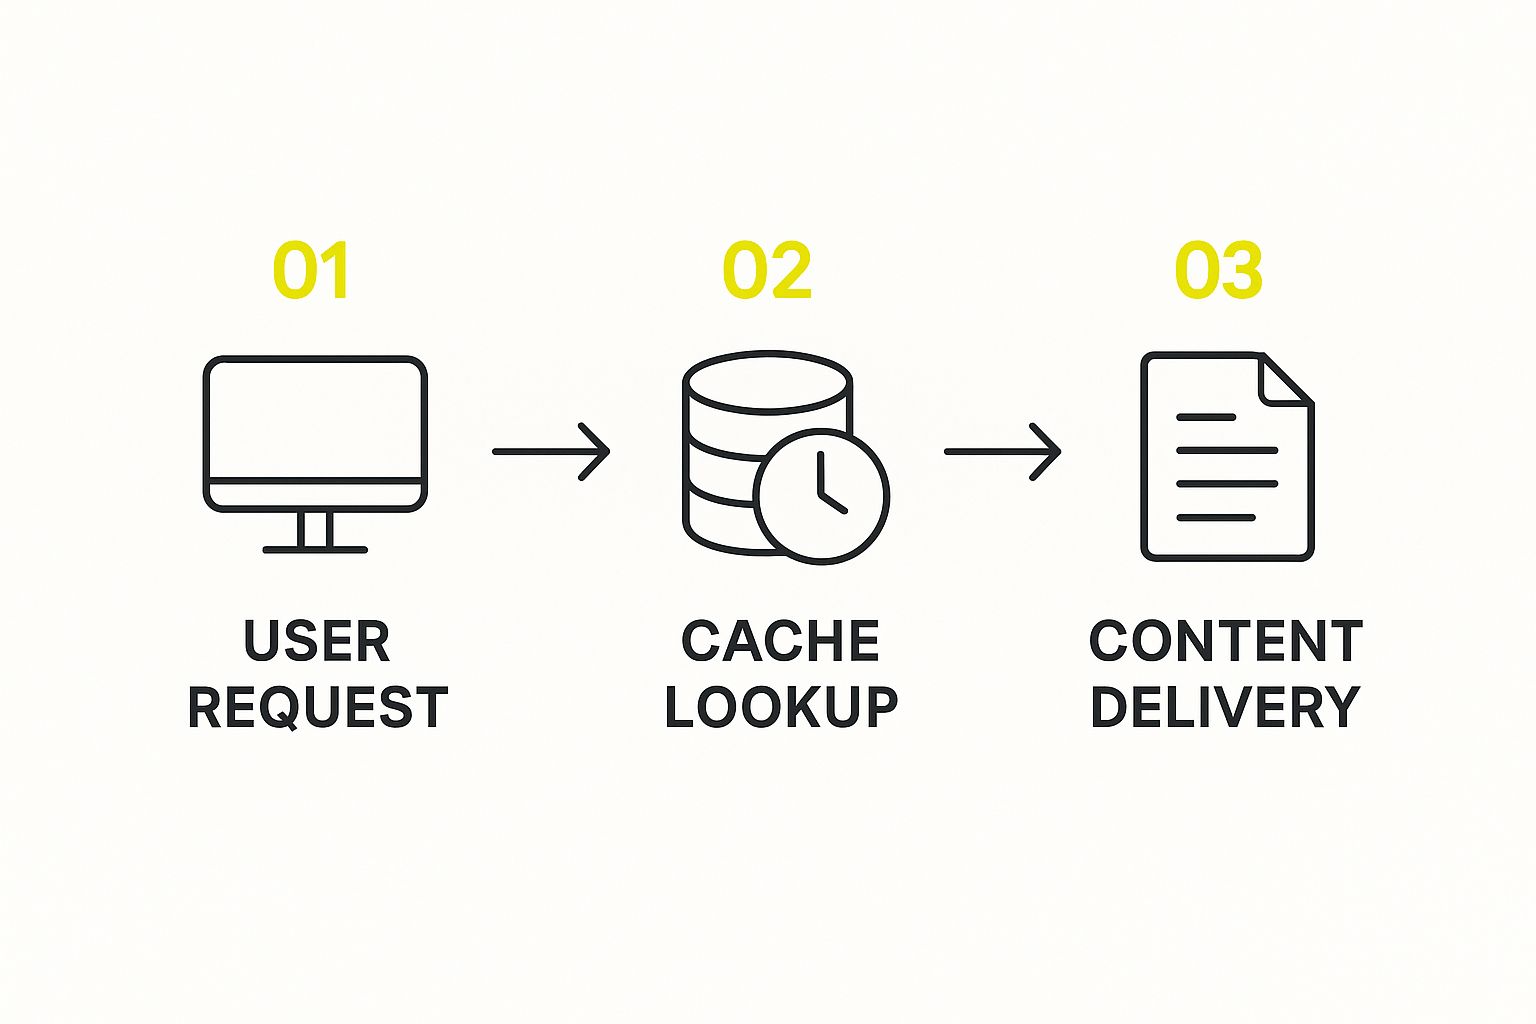
Using Caching and CDNs for Global Speed

After you've cleaned up your code and shrunk your images, you'll start hitting a wall. The next big wins in site speed come from tackling two unavoidable realities: latency and repetition. This is where server-side tools like caching and Content Delivery Networks (CDNs) make a massive difference. They're all about closing the distance between your website's files and your users, no matter where they are.
Think about it in physical terms. If your server is in Dallas, but your visitor is in Tokyo, your website data has a long trip to make. That physical distance directly translates to loading time. Smart caching and a good CDN can dramatically shorten that journey, creating a snappier experience for everyone.
Leveraging Browser Caching for Return Visitors
One of the easiest wins is to make life easier for the browser. Browser caching does exactly that by telling a visitor's browser to save certain files—like your logo, stylesheets, and JavaScript—on their computer after the first visit.
So, when that person comes back to your site, their browser doesn't have to download everything all over again. It just grabs the saved copies from its local storage. It’s a simple concept, but it makes a huge difference for your repeat visitors and takes a lot of pressure off your server.
You get to set the rules here. You can tell browsers how long to hang onto specific file types.
- Static Assets: Things that don't change, like your logo, fonts, or core CSS files, can be cached for a long time—think weeks or even months.
- Dynamic Content: Content that updates often, like the main HTML of your homepage, should have a very short cache time or none at all.
Most hosting providers and website platforms give you a straightforward way to turn on browser caching, usually with a plugin or a simple switch in your dashboard. For those on e-commerce platforms, the strategies can get even more specific. For instance, you can dig into the 5 caching methods for faster Shopify stores to see how this works in a real-world shop.
Slashing Latency with a Content Delivery Network
While browser caching is a fantastic perk for returning visitors, a Content Delivery Network (CDN) helps every single user, especially on their first visit. A CDN is essentially a network of servers spread across the globe, all holding a copy (a cache) of your site's static files.
When someone visits your site, the CDN intelligently sends them the files from the server closest to them. That user in Tokyo? They'll get your images from a server in Asia, not from Dallas. This is what slashes latency—the time it takes for data to travel—and it’s often the single most powerful change you can make for global speed.
A CDN isn't just about speed; it's also about stability. By spreading the traffic load across many servers, a CDN can handle unexpected traffic spikes and helps shield your primary server from getting overwhelmed.
Getting a CDN set up is usually quite simple. In fact, many high-quality hosting companies now bundle a CDN with their plans. While looking at these solutions, don't forget that your choice of reliable web hosting is the bedrock that all these optimizations are built on.
Comparing Popular CDN Providers
Picking the right CDN comes down to your budget, technical comfort level, and where your audience is. Here’s a quick rundown of some of the big players:
| Provider | Key Feature | Best For |
|---|---|---|
| Cloudflare | Generous free plan and top-tier security features. | Businesses of all sizes, especially those starting out. |
| Amazon CloudFront | Deep integration with AWS and pay-as-you-go pricing. | Sites already using Amazon Web Services. |
| Bunny CDN | Very affordable, high-performance, and predictable pricing. | Startups and developers who need speed on a budget. |
Putting a CDN in place is a foundational move for any serious website speed project. By shrinking the physical distance your data needs to travel, you deliver a consistently fast and reliable experience to all your users, no matter where they are.
Going Beyond the Basics: Advanced Speed Tactics and Lasting Habits
So, you've handled the low-hanging fruit—your images are compressed, your code is clean, and your server is humming along. That's a huge win and puts you ahead of the pack. But now we're chasing those last few milliseconds that separate a merely fast site from a truly exceptional one.
This is where we dig a little deeper. We'll look at some clever ways to give the browser a nudge in the right direction and, more importantly, build the right habits to keep your site blazing fast for good.
Give the Browser a Nudge with Resource Hints
Modern browsers are pretty sharp, but we can give them a little insider info to help them work even faster. We do this with resource hints—tiny snippets of code in your site's HTML that tell the browser what’s coming next.
- Prefetching: Think of this as telling the browser, "Hey, I'm pretty sure the user is going to need this file on the next page, so go ahead and grab it now while you're not busy." This works great for a critical script or stylesheet.
- Preconnecting: This one is a game-changer for third-party scripts. It instructs the browser to do the initial digital handshake (DNS, TCP, and TLS) with another server before a file is even requested.
For example, preconnecting to Google Fonts, your analytics platform, or a key ad network can easily shave off precious time. It gets the slow, tedious connection process done and dusted early.
A Quick Tip From Experience: Don't go wild with these. Prefetching too many things can actually hurt performance by hogging the user's bandwidth. My advice? Start by preconnecting to your top two or three most critical third-party domains and measure the impact.
Get a Handle on Your Third-Party Scripts
Let's be honest: scripts for analytics, ads, and social media widgets are often the biggest performance killers. You don't control them, they can be updated without warning, and they can add a ton of weight to your page.
First things first, do a thorough audit. Are you still loading that tracking pixel from a marketing campaign you ran a year ago? It's time to be ruthless. Cut out anything that isn't absolutely essential. For the scripts you have to keep, make sure they are loaded asynchronously or deferred so they don’t stop your main content from showing up.
Set a Performance Budget and Stick to It
If you take only one thing away from this section, let it be this: create a performance budget. I'm not talking about money. I’m talking about a strict set of rules for your site's technical health.
For instance, you might decide on a budget like this:
- Total page size must stay under 1.5 MB.
- Keep total HTTP requests below 70.
- Largest Contentful Paint (LCP) must happen in under 2.5 seconds.
A performance budget transforms speed from a one-time fix into a core discipline for your whole team. Suddenly, every new feature, image, or marketing tag has to be weighed against the budget. This is how you prevent "performance creep"—the slow, gradual bloat that kills fast websites over time. For more on this, check out these 8 actionable steps to significantly decrease website loading time.
Got Questions About Website Speed? Let's Clear Things Up.
Even with the best plan in hand, you're bound to run into a few questions once you start digging into your site's performance. It happens every time. Let's walk through some of the most common questions I get from clients to help you stay on track.
First up, the big one: "How fast should my site actually be?" While faster is always better, a solid goal is to get your main content showing up in under 2.5 seconds. We know from tons of user behavior studies that once you cross that three-second threshold, people start to lose patience and bounce.
Wait, Won't a CDN Make My Site Slower?
This is a classic misconception I hear all the time. It seems logical that adding another layer like a Content Delivery Network (CDN) would add a delay, but it’s actually the other way around. A CDN is one of your most powerful tools for cutting down latency—that's the physical travel time for your site's data to reach a visitor's screen.
A CDN works by storing copies of your site's files on servers all over the world. So, when someone from London visits your site, they get the data from a local London server, not from your main server in, say, Los Angeles. For any site with a geographically diverse audience, this is a non-negotiable speed boost.
Think of it this way: A CDN is like setting up local mini-warehouses for your website's data. It’s a foundational piece of a fast website, not some complicated extra.
How Many Plugins Are Too Many?
Ah, the "plugin problem." Everyone wants a magic number, but the truth is, there isn't one. The real issue isn't the quantity of your plugins; it's their quality and performance impact.
I've seen sites with 50+ well-coded plugins run faster than sites with just 10 bloated, poorly-written ones. One bad plugin can single-handedly tank your performance. The only way to know for sure is to audit them regularly.
Here’s my process:
- Run a speed test, then disable a plugin and run it again. See a big improvement? You’ve found a culprit.
- Be ruthless. If a plugin isn’t absolutely critical to how your site works or makes money, get rid of it.
- Look for overlaps. Do you have two or three plugins that basically do the same thing? Pick the best one and ditch the rest.
Keeping your plugin list lean and purposeful is one of the fundamentals of a healthy, fast-loading site.
Is your Shopify store struggling with slow load times and poor performance? At E-commerce Dev Group, we specialize in comprehensive performance audits and optimizations that turn sluggish sites into high-converting powerhouses. Discover how our expert team can elevate your store's speed and success today.