
So, what exactly are website performance monitoring tools? Think of them as your website's personal health tracker, working around the clock. These tools are designed to keep a constant eye on your site's speed, availability, and overall user experience, acting like a 24/7 digital watchdog. They're the first to know if a page is loading too slowly or if your site goes down, giving you a chance to fix things before your customers even notice.
Why Website Performance Is a Big Deal for Your Business
Your website is your digital storefront. If the doors are locked (downtime), the aisles are messy (slow loading), or the credit card machine is broken (errors), people are going to leave. It's that simple. They'll just head over to your competitor's store, and you've lost a sale. A clunky, slow website doesn't just frustrate visitors; it chips away at your brand's reputation and directly hits your revenue.
This is where performance monitoring tools really shine. They're like an automated store manager, constantly checking every corner of your digital shop to make sure everything is running smoothly. They go beyond a simple "is the site online?" check. These tools dig deep to find the root causes of performance hiccups.
The Real Cost of a Slow Website
A slow website isn't just a minor annoyance—it's a business killer. Online shoppers today are not patient. They expect things to load instantly. The whole reason these monitoring tools have become so popular is the massive demand for flawless digital experiences, especially in e-commerce.
Consider this: even a one-second delay in page load time can slash your conversions by up to 7%. It also hurts your SEO, because search engines like Google want to send users to fast, reliable websites. For a closer look at this trend, you can check out the latest market research on website performance monitoring tools.
A sluggish site directly leads to some painful outcomes:
- Sky-High Bounce Rates: Visitors will click the back button before your page even has a chance to load.
- Plummeting Conversions: Shoppers get annoyed and abandon their carts.
- A Damaged Brand: A buggy, slow site just looks unprofessional and makes you seem untrustworthy.
- Poor SEO Rankings: Google will push you down in the search results, making it harder for new customers to find you.
At its heart, website performance monitoring is all about protecting and enhancing the user experience. A smooth, fast experience keeps people engaged, builds loyalty, and drives real, sustainable growth for your business.
Key Areas Monitored for Success
To get ahead of these problems, monitoring tools focus on a few critical areas that have a direct impact on your bottom line. Getting a handle on these is the first step toward building a faster, more dependable online store. When you nail these metrics, you’ll see a direct impact on sales. We cover this in more detail in our guide to improving your e-commerce conversion rate.
To make it clearer, here’s a quick breakdown of what these tools are actually looking for and why it matters so much.
Key Areas Addressed by Performance Monitoring Tools
| Problem Area | What It Means | Why It Matters for Business |
|---|---|---|
| Uptime | Is your website online and accessible to visitors? | Every minute of downtime is lost revenue and a potential customer who might never come back. |
| Page Speed | How quickly does your content actually appear for users? | Faster pages lead to better engagement, higher conversion rates, and better search engine rankings. |
| User Experience | Is the site easy, intuitive, and pleasant to navigate? | A smooth, error-free experience builds trust and is the key to turning one-time visitors into loyal customers. |
By keeping a close watch on these three pillars, you can ensure your digital storefront is always open, welcoming, and ready for business.
Understanding Core Monitoring Concepts and Metrics
Jumping into website performance monitoring can feel a bit like learning a new language. You'll hear a lot of acronyms thrown around—RUM, TTFB, LCP—but don't let them intimidate you. Behind the jargon are two simple ways of looking at your site's health: the lab-controlled test and the real-world report.
These two methods are called Synthetic Monitoring and Real User Monitoring (RUM). They work together to give you a complete picture, but they gather data in completely different ways.
Proactive Checks with Synthetic Monitoring
Imagine hiring a "secret shopper" to visit your online store. You give them a specific script: go to the homepage, add a best-seller to the cart, and go all the way to the final checkout step. This secret shopper runs through that exact same test every hour, day or night, and reports back on how long each step took and if anything broke along the way.
That’s exactly what Synthetic Monitoring does. It uses automated bots from servers all over the world to simulate user journeys on your site 24/7. It’s a proactive way to find problems before your actual customers stumble upon them.
This approach is perfect for a few key things:
- Testing Critical Paths: It makes sure your most important user flows, like logging in or checking out, are always running smoothly.
- Benchmarking Performance: Since the tests are always the same, you can get a really clean baseline for your site's speed and reliability over time.
- Catching Issues in Off-Hours: It can alert you to downtime at 3 AM, long before your team even logs on for the day.
Think of synthetic monitoring as your early-warning system. It’s a controlled, predictable way to keep an eye on performance.
Synthetic monitoring is like a scheduled health checkup for your website. It's a controlled test that looks for potential problems, while Real User Monitoring is like tracking the daily health and activity of every single person who walks through your doors.
Real-World Insights with Real User Monitoring
Now, what if you could see precisely how every single customer navigates your store in real-time? You could see which aisles they get stuck in, what products they have trouble reaching, and how their experience changes when the store gets crowded. That’s the magic of Real User Monitoring (RUM).
RUM gathers performance data straight from the browsers of your actual visitors. It's not a simulation; it's the real deal. This gives you priceless insight into how a huge variety of people—on different devices, internet connections, and browsers—truly experience your site.
Because RUM captures real behavior, it helps you answer business-critical questions like:
- Which pages are painfully slow for my mobile customers in Australia?
- Did that new marketing campaign cause a spike in errors for people using Chrome?
- What was the actual load time for the person who just abandoned their cart?
This method gives you a raw, unfiltered look at your user experience.
Key Metrics You Need to Understand
Once you start digging in, you'll be faced with a lot of metrics. While many exist, a few are absolutely essential for understanding what your users are actually feeling. Think of these as your website's vital signs.
-
Time to First Byte (TTFB): This is how long it takes for a browser to get the very first piece of information back from your server after a request is made. If you order at a restaurant, TTFB is the time it takes for the waiter to first respond to you. A slow TTFB means your server is sluggish, leaving your visitor staring at a blank screen.
-
Largest Contentful Paint (LCP): As a key Core Web Vital, this metric measures how long it takes for the biggest visual element on the page—like a hero image or a large block of text—to load. Back at the restaurant, LCP is the time it takes for your main course to arrive. For a good experience, you want your LCP under 2.5 seconds.
-
Error Rate: This simply tracks the percentage of visits that result in an error, like a dreaded "404 Not Found" or a "500 Internal Server Error." A high error rate means parts of your site are broken, which is a fast track to frustrating users and losing sales.
For Shopify store owners, keeping these numbers healthy is non-negotiable. You can learn much more about how to monitor Core Web Vitals in Shopify to keep your e-commerce engine humming.
If you want to zoom out and get a broader perspective on growth, exploring these essential website metrics can be a great next step. By getting a handle on these concepts and metrics, you can turn confusing data into smart decisions that directly improve your customer's experience and your bottom line.
Essential Features To Look For In Monitoring Tools
With so many options out there, picking the right website performance monitoring tool can feel a bit like finding a needle in a haystack. But if you know what to look for, you can quickly narrow down the field. Think of it like choosing a security system for your store—you need more than just a bell on the door.
You need a system that alerts you instantly, shows you exactly what’s happening, and helps you spot patterns over time. The market for these tools is booming for a reason: they are absolutely essential for spotting performance problems and keeping your business running smoothly. For a deeper dive, you can read the full analysis on the website monitoring market. A truly great tool doesn't just throw data at you; it turns that data into clear, actionable insights that protect your revenue.
Real-Time Alerting And Notifications
First and foremost, a monitoring tool has to tell you when something is wrong—right away. If you’re waiting for a customer to complain about an outage, you’re already behind and losing money. Real-time alerting is your first line of defense, sending an instant notification the second a problem pops up.
Look for tools that can plug directly into your team's daily workflow. The best platforms don’t just send an email into the void; they deliver alerts where your team will actually see them.
- Email: Good for detailed, formal notifications.
- SMS: Perfect for critical, can't-miss alerts when you're away from your computer.
- Slack or Microsoft Teams: Ideal for getting your development team to jump on a problem and troubleshoot it together, in real-time.
This kind of immediate feedback loop is what shifts a team from being reactive to proactive, letting them fix issues before they ever become a big deal.
Customizable Dashboards For Data Visualization
Raw data is just a mess of numbers. Without context, it's pretty useless. A powerful monitoring tool must offer customizable dashboards that let you see the metrics that matter most to your business. It's like having a personalized control panel for your website's health.
For an e-commerce store, that might mean putting checkout success rates and page load times for your best-selling products front and center. For a blog, you'd probably focus more on Core Web Vitals and uptime. The ability to drag and drop widgets to build your own view means you get a clear, at-a-glance summary without having to dig for it.
A great dashboard tells a story. It should instantly answer your most important questions: "Is the site up?" "Are my customers having a good experience?" and "Where can we make the biggest improvements?"
Historical Data And Trend Analysis
Fixing today’s problem is great, but preventing tomorrow’s is even better. This is where historical data analysis becomes so valuable. A solid tool will hang onto performance data for weeks, or even months, allowing you to spot recurring issues and long-term trends.
For instance, you might notice your site gets sluggish every Friday afternoon. By looking back at the data, you could correlate this slowdown with a weekly inventory update that's hogging server resources. That insight lets you reschedule the task to an off-peak time, solving the problem for good. Without that historical view, you’d just be putting out the same fire every single week.
The image below shows how different tools can highlight different performance baselines, which is a core part of historical analysis.
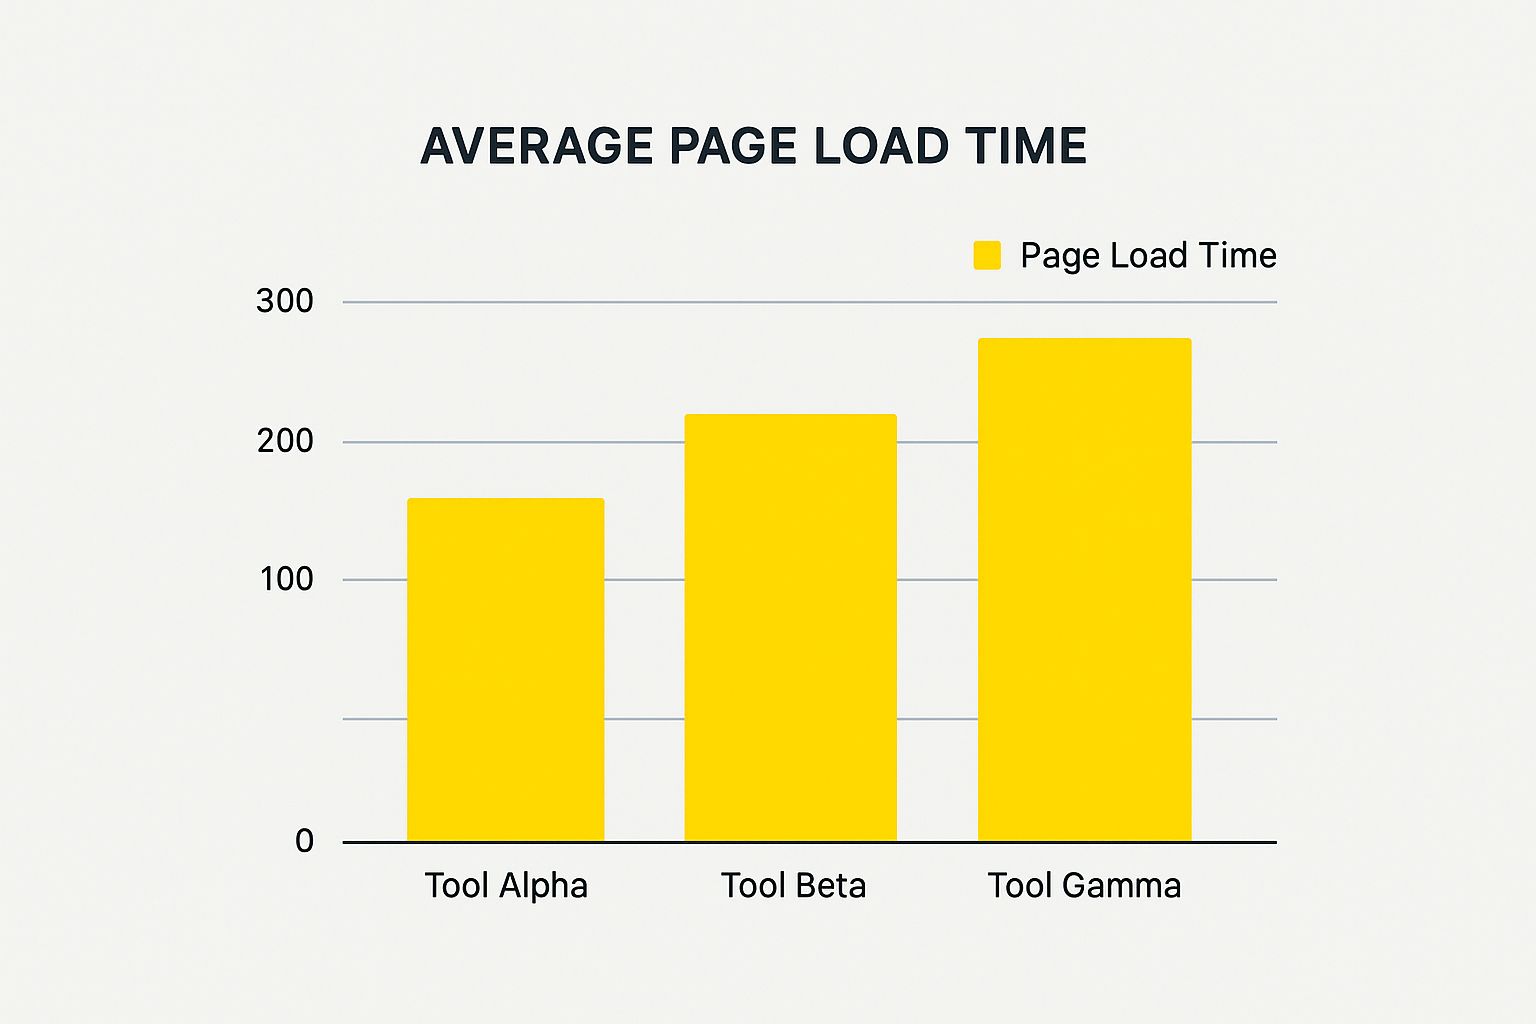
Here, it's clear that Tool Alpha consistently delivers a faster average page load time—a critical piece of information when setting your own performance goals.
Detailed Root Cause Analysis
When an alert goes off, the very next question is always, "Why?" The most helpful monitoring tools are the ones that provide root cause analysis features to answer that question fast. They don't just tell you a page is slow; they pinpoint the exact element causing the jam.
This could be anything from a clunky database query to a massive, unoptimized image or a third-party script that's taking forever to load. The best tools even provide things like waterfall charts or session replays, giving developers a visual map of the entire page load process. This level of detail can slash debugging time from hours to just minutes, freeing up your team to build cool new features instead of chasing ghosts in the code.
To help you compare what's out there, here's a quick breakdown of these key features and what they mean for you.
Comparison Of Key Monitoring Tool Features
| Feature | What It Does | Why You Need It | Example Tool |
|---|---|---|---|
| Real-Time Alerting | Sends instant notifications (via email, SMS, Slack) when a performance issue or outage is detected. | Allows you to respond immediately to problems, minimizing downtime and protecting revenue. | Pingdom |
| Custom Dashboards | Lets you create a personalized view of the key performance indicators (KPIs) that matter most to you. | Provides an at-a-glance health check of your site, so you don't have to hunt for important data. | Datadog |
| Historical Analysis | Stores performance data over time, enabling you to identify trends, patterns, and recurring issues. | Helps you move from reactive firefighting to proactive problem-solving by spotting long-term trends. | New Relic |
| Root Cause Analysis | Drills down into performance issues to identify the specific script, image, or query causing a slowdown. | Drastically reduces debugging time for your developers, getting your site back to full speed faster. | Sentry |
Ultimately, the goal is to find a tool that doesn't just collect data, but makes that data easy to understand and act on. Focusing on these core features will ensure you get a solution that provides real, tangible value to your e-commerce business.
How to Choose the Right Tool for Your Business

Picking the right website performance monitoring tool isn’t about grabbing the one with the longest feature list. It's about finding the perfect fit for your business's unique pulse. A tool that’s a lifesaver for a massive e-commerce brand might be total overkill for a small services firm.
The secret is to match the tool’s capabilities to your specific goals, budget, and the technical comfort level of your team.
Think of it like buying a vehicle. A professional race car driver needs a Formula 1 car packed with complex telemetry. A family just needs a reliable SUV to get around town safely. Buying the race car for school runs would be expensive, complicated, and honestly, not very effective. The same idea applies here—you want to avoid paying for bells and whistles you'll never use or picking a tool so complex that no one knows how to use it.
Aligning Tools with Your Business Model
Your business model is the single most important factor in this decision. What your website does determines which performance metrics are absolutely critical and which are just nice to have.
For an e-commerce store, everything revolves around the transaction. The most important features will be things like:
- Transaction Monitoring: You need to simulate the entire customer journey—from adding an item to the cart all the way through checkout—to guarantee that process is always smooth.
- Real User Monitoring (RUM): It’s crucial to see data from actual shoppers to understand how page speed is impacting cart abandonment in real time.
On the other hand, a content-heavy blog or a B2B software company has a completely different set of priorities. Their focus is more likely on:
- Core Web Vitals: Tracking metrics like Largest Contentful Paint (LCP) is key for SEO and keeping readers on the page.
- API Monitoring: They need to know that the endpoints powering their software are fast and reliable for their business clients.
Key Questions to Guide Your Decision
Before you even start looking at demos, get your team together and answer a few core questions. This simple exercise creates a clear framework for your decision and keeps you from getting distracted by a slick sales pitch. A solid grasp of your needs is the first step in learning how to test website performance effectively.
Ask yourselves these critical questions:
- What is our budget? Be realistic about what you can spend monthly or annually. These tools can range from free to thousands of dollars a month.
- Who will use this tool? Is it for a dedicated DevOps engineer who lives and breathes data, or for a marketing manager who just needs a simple, high-level dashboard? The user interface has to match the user.
- What are our must-have features? Based on your business model, make a non-negotiable list. Do you absolutely need real-time Slack alerts? In-depth root cause analysis? Both?
- How much do we need to scale? Pick a tool that can grow with you. A small startup might only need basic uptime checks now, but will require much more as traffic grows.
This strategic thinking is becoming more common as businesses across finance, healthcare, and education recognize the value of performance monitoring. E-commerce companies, especially, depend on these tools to protect the speed and availability that directly affect sales and customer happiness.
Choosing a monitoring tool is a strategic business decision, not just a technical one. The right tool should feel like a natural extension of your team, providing clear, actionable insights that help you protect your revenue and delight your customers.
By starting with what you need—not with a list of popular software—you’ll find a tool that delivers real value. It will help you go from just collecting data to making smart, informed decisions that actually drive your business forward.
Putting Your Monitoring Strategy to Work
Getting a website performance monitoring tool is a bit like buying a top-of-the-line fitness tracker. It's great to have, but it won't make you healthier if you never actually look at the data. The real magic happens when you use the information it gives you to make smart, meaningful changes. A solid monitoring strategy is what turns that raw data into a real-time plan for managing your site's performance.
It’s about more than just getting a ping when your site goes down. A successful strategy creates a constant feedback loop. Performance data should feed directly back into your development cycle, highlight areas for improvement, and ultimately, protect your revenue. It makes website performance a shared goal for everyone on your team.
Setting Baselines and Smarter Alerts
First things first: you need to know what "normal" looks like for your website. This is your performance baseline. Without it, you can't tell the difference between a minor hiccup and a full-blown emergency. Just let your monitoring tool run for a week or two, tracking things like page load times and how long transactions take. This will give you a clear benchmark for typical performance.
Once you have that baseline, you can set up intelligent alerts that only go off when something is genuinely wrong. This is the secret to avoiding alert fatigue—that all-to-common problem where your team gets so bombarded with notifications they just start tuning them out.
A smart alert system should be:
- Contextual: Alerts need to tell you what's broken and how bad it is. An error on your "About Us" page is one thing; a complete failure in your checkout flow is a five-alarm fire.
- Tiered: Not every issue deserves a 3 a.m. wake-up call. A minor slowdown might just warrant an email, while a site-wide outage should trigger an SMS or a loud Slack notification.
- Actionable: A useful alert gives your team a head start. It should include enough detail—like a specific error log or the user journey that failed—so a developer can jump right in and start fixing things.
The goal isn't just to get alerts about problems. It's to get alerts about the right problems at the right time, with enough information to solve them fast. That’s when your monitoring tool stops being a noisemaker and starts being a problem-solver.
Weaving Monitoring into Your Daily Workflow
The best teams don't treat performance monitoring as a separate, isolated task. They build it right into the fabric of how they work. This creates a culture where everyone thinks about performance from the start, not just after a customer emails to complain. When you're planning your monitoring strategy, it's also worth understanding how a managed IT infrastructure can take care of the heavy lifting, including the continuous monitoring itself.
When it's properly integrated, developers check performance metrics before and after they push new code live. Your marketing team can see if a big new campaign is putting too much strain on the servers. This continuous feedback ensures every change is measured by its impact on the user, leading to a much faster and more reliable site over the long haul.
Specific Tips for Shopify Merchants
If you're running your store on Shopify, a focused monitoring strategy is absolutely essential. The platform is fantastic, but its reliance on third-party apps means it's easy for a rogue app to slow everything down.
Here are a few Shopify-specific things to watch:
- Monitor Your Apps: Use your tool to see how new apps affect your load times. You'd be surprised how often a single, poorly-coded app is the main culprit behind a slow site.
- Track the Money Path: Set up monitors for your entire purchase funnel. You want to know immediately if there's a problem with adding a product to the cart, going through checkout, or reaching the final thank-you page.
- Keep an Eye on Theme Changes: Every time you tweak your theme's code, watch your Core Web Vitals like a hawk. A tiny change to a CSS or JavaScript file can sometimes have a massive, unexpected impact on performance.
By building a thoughtful strategy, you can transform your website performance monitoring tool from a passive dashboard into an active engine for growth, constantly improving your customer's experience and driving your business forward.
Conclusion: Turning Performance Data into Business Growth
Diving into the world of website performance monitoring tools can feel a bit technical at first, but the payoff is huge. Think of these tools as the vigilant manager for your digital storefront, working around the clock to make sure every customer has a great experience.
This isn't just about avoiding error messages or slow pages. It's a core business strategy. A faster, more reliable website leads directly to happier customers, a brand people trust, and, most importantly, more sales. The gap between a booming online store and one that just gets by often boils down to being proactive about performance.
From Monitoring to Mastery
Getting to a high-performing website is a cycle: you monitor, you analyze what you find, and you make improvements. It all starts with grasping the basics, then choosing the right tool for your store, and finally, putting it into action intelligently. Each step builds on the last, turning confusing numbers into real, measurable growth.
The goal is to stop just putting out fires. The real magic happens when you use performance data to get ahead of problems and consistently make your customers' experience better.
Think of performance data as the voice of your customer. It tells you exactly where they get stuck, where they hesitate, and where everything is working perfectly. Listening is the secret to building a site they love coming back to.
Your Next Step Toward a Faster Website
The best part is, you don't need to be a technical guru to start. The first move is simply to figure out where your site stands right now.
Use what you've learned here to check out a few tools, set up some basic monitors, and get a baseline reading. This simple step is the beginning of a much faster, more profitable online store.
By investing in website performance monitoring, you’re really investing in your customers. You’re promising them a fast, frustration-free experience that builds loyalty and drives your business forward. The tools are out there—it's time to put them to work and turn your site's performance into your biggest competitive edge.
FAQ
Diving into website performance monitoring can feel like learning a new language. Let's tackle some of the most common questions that pop up so you can get started with confidence.
Can I Start with Free Monitoring Tools?
Absolutely. In fact, it's a great way to get your feet wet. Tools like Google PageSpeed Insights are perfect for a first look, helping you understand the basics and catch any glaring issues on your site. For a small business or someone just beginning, they’re an excellent entry point.
But you'll likely hit a ceiling with free tools pretty quickly. They usually don't offer the continuous, automated monitoring that a growing e-commerce store really needs. Think of it this way: a free tool is like a one-time snapshot, while a paid service is a 24/7 security camera, always watching and alerting you the second something goes wrong. When your website's health is directly tied to your income, that constant vigilance is a must-have.
How Often Should I Check My Website Performance?
The honest answer? You shouldn't have to manually check it very often at all. That's the whole point of a dedicated website performance monitoring tool—it does the heavy lifting for you. It’s always on, checking your site from different places around the world.
A good monitoring tool is designed to ping you the moment it finds a problem, so you can fix it before it costs you sales. That said, it's a good habit to glance at your performance dashboard about once a week. This helps you spot slower-moving trends or find new opportunities for improvement. And, of course, you should always run a check right after making any big changes to your site, just to make sure you didn't accidentally slow things down.
The goal is to move from reactive spot-checks to a proactive, automated system. Let the tool watch your back so you can focus on bigger things.
What Is the Difference Between Uptime and Performance Monitoring?
This is a really important one, and it's easy to get them mixed up. Let's use a brick-and-mortar store analogy to make it clear.
-
Uptime Monitoring: This is simply checking if the front door of your store is unlocked. Is the "Open" sign on? It tells you if your website is online and reachable. If your server crashes, the site is "down," and your uptime monitor will let you know.
-
Performance Monitoring: This is about what happens after a customer walks through that unlocked door. Are the lights flickering? Is there a long line at the checkout? Can they find what they're looking for? A site can have 100% uptime but be so painfully slow or broken that customers leave in frustration.
Performance monitoring keeps an eye on the actual user experience—things like page speed, how quickly images load, and whether the checkout process works smoothly. Uptime gets people in the door, but performance is what makes them stay and buy.
Ready to stop guessing and start knowing exactly how your Shopify store is performing? The experts at E-commerce Dev Group can help you implement a robust monitoring strategy that turns performance data into real business growth. Contact us today to optimize your store for speed and sales.