

Understanding Your Store's Digital Fortune Teller
Imagine strolling into your brick-and-mortar store and instantly knowing which items are flying off the shelves, how long people linger by the displays, and why some leave empty-handed. That's the power of Shopify's analytics dashboard. It’s like having a silent conversation with every visitor to your online shop. But this power comes with the responsibility of knowing how to use it. We'll explore how successful merchants transform this wealth of data into actionable strategies.
This isn’t about drowning in numbers; it's about understanding the story they tell. Why do some business owners eagerly check their dashboards every morning, while others feel lost in the data deluge? The difference lies in understanding which metrics truly matter for their business. It's the difference between guessing and knowing.
Think of your dashboard as the cockpit of your business. You wouldn't want to fly a plane with every light flashing and alarm blaring. Similarly, your Shopify analytics dashboard shouldn't be a source of confusion. Savvy merchants tailor their dashboards to reflect their unique goals and where their business is in its growth journey.
This personalized approach is crucial. A 2% conversion rate might be a victory for a highly specialized store but a warning sign for a brand targeting a broader audience. The key is to pinpoint the metrics aligned with your specific aims. The Shopify Analytics dashboard has evolved to offer a more tailored and streamlined experience. As of 2025, Shopify allows users to fully customize their dashboards, picking and choosing the metrics most relevant to their business.
This customization extends to the mobile app, allowing you to keep an eye on key performance indicators from anywhere. Navigating the vast sea of available data can be daunting for e-commerce entrepreneurs. Tools like Shopify Analytics simplify this by zeroing in on essential data points like total sales, conversion rates, and average order value. This empowers businesses to scale strategically, basing decisions on concrete data, not gut feelings.
For a deeper dive into the power of Shopify’s updated analytics, check out this helpful video: Discover more on Shopify Analytics. This focus on personalization transforms raw data into a powerful engine for growth. It’s about moving beyond feeling overwhelmed and unlocking your store’s full potential.
Translating Numbers Into Business Intelligence
Stepping into your Shopify analytics dashboard can feel a bit like entering a bustling marketplace for the first time. Numbers everywhere, and it’s hard to know where to focus your attention. Let’s break down the essential metrics that truly fuel growth, starting with the core three: total sales, conversion rates, and average order value. But more than just defining them, we'll explore the stories they tell about your customers.
Imagine you’re a detective examining clues. A 2% conversion rate might be a fantastic result for a boutique selling handcrafted jewelry, signifying strong appeal among a select audience. However, that same 2% could be a red flag for a large online clothing store catering to a broader market. Grasping this nuance is key to understanding your performance. One of your primary clues is the conversion rate, the percentage of visitors who make a purchase. Littledata suggests the average Shopify conversion rate hovers around 1.4%, but this fluctuates widely depending on the industry. Knowing your conversion rate is essential for refining your marketing efforts and improving the online shopping experience. Discover more insights.
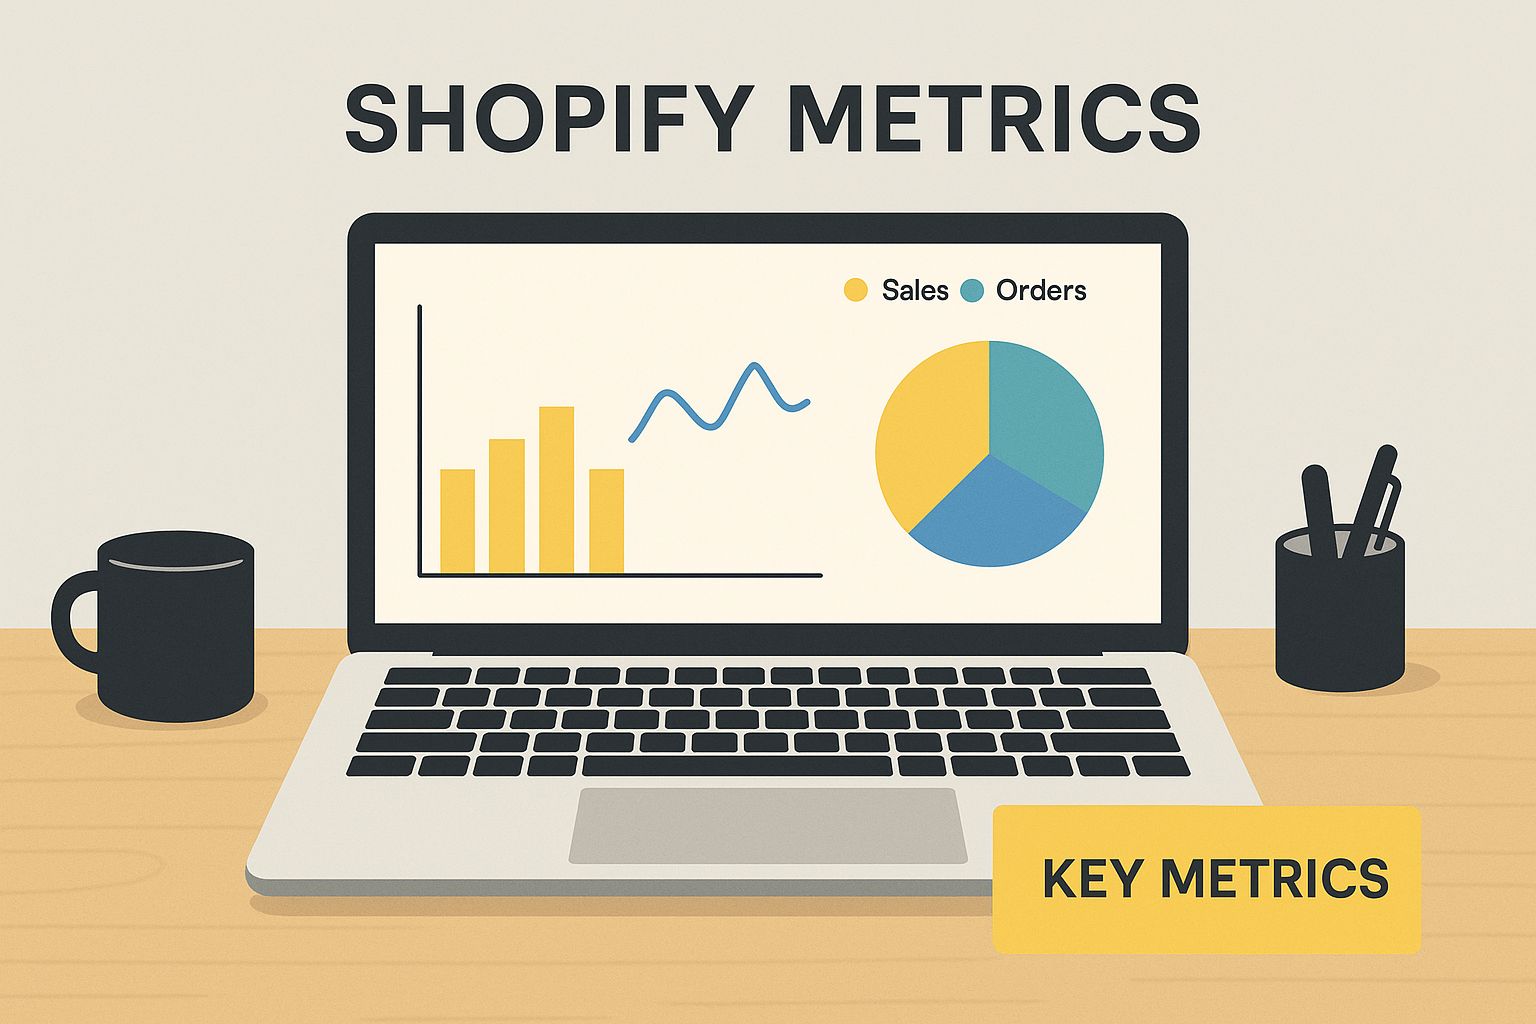
The infographic above paints a picture: a laptop displaying vibrant Shopify charts, highlighting those key metrics. It’s a visual reminder of how crucial it is to monitor these key performance indicators (KPIs) in real-time to get a pulse on your store’s health. This allows you to quickly adapt to trends and customer behavior, much like a captain adjusting course based on changing winds.
Now, let’s consider average order value (AOV). Picture two stores with identical total sales. One achieves this through many small orders, like a busy cafe serving numerous cups of coffee. The other, through fewer but larger orders, perhaps like a furniture store selling higher-priced items. This reveals different customer buying patterns and suggests different growth strategies. For instance, the cafe might focus on loyalty programs, while the furniture store might explore personalized recommendations. You might find this interesting: Shopify Analytics for Marketing ROI.
Deciphering Your Data
This isn't just about chasing impressive-looking numbers, it's about understanding the metrics that truly contribute to your bottom line. Think of it as separating the signal from the noise.
To help you benchmark your store's performance, let's look at the following table which compares key Shopify metrics with industry averages. This will help you understand where you stand and identify areas for potential improvement.
Essential Shopify Metrics and Industry Benchmarks
| Metric | Industry Average | Good Performance | Excellent Performance | What It Tells You |
|---|---|---|---|---|
| Conversion Rate | 1.4% | 2-3% | 4%+ | How effective your store is at converting visitors into customers |
| Average Order Value (AOV) | Varies by industry | Above industry average | Significantly above average | The average amount customers spend per order |
| Customer Lifetime Value (CLTV) | Varies by industry | Increasing over time | Consistently high | The total revenue you can expect from a single customer over their relationship with your store |
| Bounce Rate | 40-55% | Below 40% | Below 30% | The percentage of visitors who leave your site after viewing only one page |
Understanding these benchmarks will allow you to identify areas of strength and weakness in your store's performance. For instance, if your AOV is below average, you might consider upselling or cross-selling strategies.
By focusing on the right metrics and interpreting them effectively, you transform raw data into actionable insights. This empowers you to make informed decisions, optimize your strategies, and steer your Shopify store toward sustainable growth.
Crafting Your Personalized Command Center
Imagine your Shopify analytics dashboard not as a jumbled mess, but as a well-organized toolbox, perfectly equipped for every job. Savvy merchants understand that tracking every single data point isn't the goal. Instead, they focus on the metrics that truly matter to their specific business. This section explores how to create a dashboard that works for you, reflecting the unique needs of your business model.
Building Your Dashboard Strategy
Let's compare two different merchants. One sells high-end, handcrafted goods and focuses on building long-term relationships with customers. The other sells everyday products and prioritizes high sales volume and quick conversions. Their dashboards will naturally look different.
The artisan might track customer segmentation data and repeat purchase rates to understand their loyal customer base. The other merchant might focus on daily sales trends and cart abandonment rates to optimize their sales funnel. Both approaches are valid, highlighting how personalization is key. For a deeper dive into analytics, resources like Postingcat's analytics features can be invaluable.
This tailored approach transforms your dashboard from a source of overwhelm into a powerful decision-making tool. And remember, your dashboard should adapt as your business grows. The metrics you track during a product launch will likely differ from those you monitor during a period of steady growth.
Creating Multiple Dashboard Views
Think of your dashboard as having multiple lenses, each offering a unique perspective. You might create a "Morning Health Check" view with key metrics like daily sales and website traffic. For a deeper look, a "Weekly Deep Dive" could display sales breakdowns by product and marketing channel performance. Finally, a "Monthly Strategic Review" could focus on overall growth trends and key performance indicators (KPIs).
Mobile Optimization: Data on the Go
The Shopify mobile app puts your personalized command center right in your pocket. This gives you incredible freedom and flexibility. Imagine checking your key metrics between meetings or receiving real-time alerts about a sudden surge in sales.
This mobile access is a game-changer, especially for busy entrepreneurs. It allows you to stay connected to your business’s performance without being chained to your desk. By strategically crafting your dashboard, you transform it from a source of data overload into a valuable asset that fuels informed decision-making.
Developing Your Data Detective Skills
Successful online merchants don't just glance at the numbers in their Shopify analytics dashboard. They actively engage with their data, asking questions and searching for clues. This section explores how to develop pattern recognition, a crucial skill that allows you to spot opportunities and address potential issues before they become major problems.
Think of your Shopify dashboard like a treasure map. The raw data represents the landscape, but the real treasure—the actionable insights—lies hidden in the patterns. We'll explore practical techniques to help you ask the right questions of your data, uncovering valuable information that can drive your business forward. This might involve identifying subtle seasonal shopping trends or recognizing early warning signs that a product page isn't performing as expected.
Connecting the Dots Between Metrics
Imagine you notice your conversion rate has dipped. At the same time, your bounce rate is creeping upwards. On their own, these two metrics might not seem related, but together, they could be telling a story. Perhaps a recent website update has inadvertently made navigation more difficult, frustrating potential customers and sending them clicking away to your competitors.
Through real-world examples of online stores just like yours, you’ll learn how to connect these seemingly disparate data points within your Shopify analytics dashboard. This skill will empower you to unearth hidden insights that others might miss, giving you a competitive edge. For a deeper dive into analyzing specific campaign data, check out this helpful guide: Analyzing Campaign Data in Shopify.
Forecasting Future Performance with Historical Data
Smart merchants understand the power of historical data. It's not just about looking back; it's about looking forward. Imagine tracking your average order value (AOV) over the past year. By analyzing this historical trend, you can identify peak periods and predict future fluctuations. This allows you to make informed decisions about inventory, marketing spend, and customer engagement strategies, ensuring you're prepared for whatever comes next.
Recognizing Anomalies vs. Trends
Just as a doctor monitors a patient's vital signs, you need to learn how to distinguish between normal data fluctuations and more concerning anomalies. This involves understanding what "normal" looks like for your particular business and knowing when to investigate unexpected spikes or dips. This focused approach allows you to prioritize your time and energy, addressing the trends that truly matter to your bottom line. By developing this skill, you’ll transition from reactive decision-making to a proactive, strategic approach, setting your business up for sustainable growth.
Turning Insights Into Revenue-Driving Actions
Having insightful data from your Shopify analytics dashboard is like having a compass. It can point you in the right direction, but it won't get you to your destination unless you take action. This section focuses on turning those interesting data patterns you see into concrete steps that boost your bottom line. We'll explore how real merchants used their data to make impactful decisions, from smarter inventory management and strategic marketing spending to better product descriptions and happier customers.
From Data to Dollars: Real-World Success Stories
Imagine a clothing store noticing a surprising spike in winter coat views during the summer. Instead of ignoring it, they dug deeper and found customers in the Southern Hemisphere browsing their site. This led them to create targeted winter promotions for that audience, boosting sales during their cold season – the store's off-season.
Another merchant, after reviewing their Shopify analytics dashboard, realized a specific product had a high cart abandonment rate. Turns out, the product description was unclear. They rewrote it to be more concise and user-friendly, resulting in a significant increase in conversions for that very product.
These are just two examples of how data insights can drive action. To optimize your own actions, consider the impact of social media on your overall return on investment (ROI). This resource can help you assess and strategize: social media ROI strategies.
Building a Culture of Continuous Optimization
Using data to drive action isn’t a one-time fix; it’s an ongoing process. It’s like tending a garden – you constantly monitor, adjust, and nurture your efforts to ensure continuous growth. This involves testing theories based on your data, carefully measuring the results of any changes you make, and fostering a culture of continuous improvement within your team.
Prioritizing Your Action Plan
Your Shopify analytics dashboard can reveal many areas for improvement, which can feel overwhelming. Focus on the insights that best align with your overall business goals. For example, if your main objective is to increase average order value (AOV), concentrate on insights related to upselling, cross-selling, and offering product bundles. Need help optimizing your sales channels? Check out our guide on analyzing Shopify sales channels.
A Framework for Data-Driven Decisions
To help structure your approach to data-driven decisions, we’ve developed a simple framework. This table outlines a step-by-step process for turning insights into actionable business improvements.
Let’s take a look at the Data-Driven Decision Framework below:
| Data Signal | Potential Cause | Action to Take | Success Metric | Timeline |
|---|---|---|---|---|
| High bounce rate on product page | Confusing product description | Rewrite description for clarity | Increased conversion rate for that product | 1 week |
| Low average order value | Customers unaware of related products | Implement cross-selling recommendations | Increased average order value | 2 weeks |
| Decrease in website traffic | Drop in organic search rankings | Optimize website content with relevant keywords using a tool like Semrush | Increased organic search traffic | 1 month |
This framework allows you to systematically move from observation to action, ensuring your insights translate into tangible business results. By using this process, your Shopify analytics dashboard becomes more than a reporting tool – it becomes a powerful engine for revenue growth.
Avoiding Common Analytics Pitfalls That Kill Productivity
Even with the best tools, like your Shopify analytics dashboard, it's easy to get lost in the data weeds. Many business owners, despite their best intentions, fall into common traps. Let's explore these pitfalls and how to avoid them to make your data analysis more productive.
Obsessing Over Daily Fluctuations
Think about constantly checking your stock portfolio. The minute-by-minute changes are exciting, but ultimately distracting and not a good indicator of long-term performance.
Your Shopify data is similar. Getting fixated on daily ups and downs can pull your focus from the overall trends. Daily numbers are often volatile, affected by things like flash sales or even the day of the week. Instead, concentrate on broader trends that reveal meaningful patterns.
Chasing Vanity Metrics
Some metrics look impressive but don't tell the whole story. Website traffic is a classic example. High visitor numbers are meaningless if they aren't converting into sales.
Within your Shopify analytics dashboard, focus on metrics directly tied to your revenue goals, such as conversion rates and average order value (AOV). These are the numbers that truly matter.
Decision Paralysis by Analysis
It’s possible to have too much of a good thing. Imagine a chef with a pantry packed with ingredients, but so overwhelmed they can’t decide what to cook.
A cluttered dashboard can have the same effect. Choose a few key metrics and track those consistently. More data isn’t necessarily better; focused data is.
Overlooking Your Merchant Instincts
Data is vital, absolutely. But don’t ignore your intuition. Sometimes, your gut feeling picks up on things the numbers haven't revealed yet.
Use your Shopify analytics dashboard as a powerful tool, but remember your own experience and knowledge of your specific business. The smartest decisions often combine data insights with good old-fashioned judgment.
Perfectionism Prevents Progress
Waiting for perfect data is like waiting for the perfect moment – it’ll never arrive. Data is always imperfect. There will be limitations and uncertainties.
Don't let the desire for perfect insights stop you from taking action based on the information you have. You can always adjust and refine your strategy as you gather more information. Think of it as a continuous learning process.
Your Roadmap To Analytics Mastery
Turning data into actionable steps is a journey. This section gives you a practical roadmap to becoming truly data-driven with your Shopify decisions, no matter your current analytics skills. Whether you're just starting out or want to improve your approach, this guide shows you how to make your Shopify analytics dashboard a strategic asset, not just a reporting tool.
Building Your Analytics Foundation
If you’re new to Shopify analytics, begin with the fundamentals. Concentrate on understanding the core metrics: total sales, conversion rates, and average order value. Create a simple dashboard view with these metrics and check it daily to get familiar with the data. Spend 15-30 minutes each day with your dashboard, gradually increasing the time as you get more comfortable.
- Week 1: Consistently review your core metrics.
- Week 2: Explore the various report types in the Shopify analytics dashboard.
- Week 3: Customize your dashboard, adding and removing metrics as you see fit.
Refining Your Analytical Approach
Once you’re comfortable with the basics, start using more advanced techniques. Begin segmenting your data to understand customer behavior better. For example, analyze sales data by product category, geographic location, or marketing channel. Introduce one new analytical technique each week, such as cohort analysis or calculating customer lifetime value.
- Month 1: Explore the different segmentation options within the Shopify analytics dashboard.
- Month 2: Track historical trends to spot patterns and anticipate future performance.
- Month 3: Integrate data-driven insights into your decision-making.
Mastering Data-Driven Decision Making
The ultimate goal is to use data to improve your business. Develop a system for turning insights into action. This could involve A/B testing product descriptions based on cart abandonment rates, or adjusting marketing spend based on how each channel performs. Schedule regular monthly review meetings to analyze progress and find new optimization opportunities.
- Quarter 1: Implement data-driven changes to your marketing or operations.
- Quarter 2: Track the effects of those changes and adjust as needed.
- Quarter 3: Create a continuous improvement process so data consistently informs your decisions.
By following this roadmap, you’ll develop the skills and habits to become a data-driven merchant. You’ll unlock the power of your Shopify analytics dashboard for sustainable business growth. Ready to take your Shopify store to the next level? Partner with E-commerce Dev Group for expert guidance and support. Visit our website to learn more about our comprehensive Shopify services.